


Most teams waste thousands per month on analytics tools that don’t match how they work. You’re either paying enterprise prices for features you never use, or you’re cobbling together free tools that can’t answer basic product questions. Both approaches cost you money.
I’m JJ Reynolds, founder of VisionLabs. After implementing analytics tools for dozens of teams, I’ve seen the same pattern: companies buy based on demos, not on how their team actually operates. Let me fix that.
I’ve implemented Google Analytics, Heap, Full Story, Mixpanel, Amplitude, and PostHog across dozens of companies. Here’s what actually matters when you’re choosing an analytics tool in 2026.
The Best Product Analytics Tools by team capabilities (2026):
- Non-technical marketers: Start with Google Analytics. When you outgrow it, move to Mixpanel or Amplitude.
- Non-technical product teams: Mixpanel or Amplitude. They’re built for your workflow and won’t require engineering to answer basic questions.
- Technical product teams: PostHog. You’ll save money and gain features, but expect to invest setup time.
- Developer-focused debugging: Full Story if budget allows. Microsoft Clarity if it doesn’t.
- Teams with unlimited budget: Heap, I guess? Though I’d still question why you’re paying premium prices for gated features.
We made a calculator to help you understand what’s your best product analytics tool based on your use case:
Find Your Perfect Analytics Tool
Answer 4 quick questions to get tailored recommendations.
Top Matches:
The price vs features matrix: to Analyze which Product Analytics tool is better for your team
Most analytics comparisons pretend all tools serve the same purpose. They don’t. Some are built for marketers who need quick answers. Others target developers who want to see every network request. The price rarely correlates with what you actually get.
Let me show you the real landscape using a typical SaaS example: 50 monthly active users, 5 million events per month, $200/month product. This puts you in the sweet spot where pricing differences become obvious.
Best Product Analytics tool Matrix – see our comparison of Looker Studio, Power BI, Tableau, and other visualization tools

Google Analytics: free doesn’t mean limited
Google Analytics gets dismissed by product teams, but that’s shortsighted. At 5 million events per month, you’re still on their free plan. Zero dollars. It answers most marketing questions phenomenally well.
- Price: $0 per month
- Best for: Marketing analytics without product depth
The limitation kicks in when you need product analytics. User IDs, custom events, cohort analysis—these get complicated fast. Google Analytics doesn’t do heat maps or session recordings, so you’ll need to stack another tool on top.
I recommend Google Analytics when your primary questions are marketing-focused and your budget is tight. Just know you’ll outgrow it the moment product becomes your priority.
If you’re combining GA4 with visualization tools, advanced charts require different preparation—box plots and waterfall charts need your data structured properly before you can display trends in dashboards like Looker Studio.
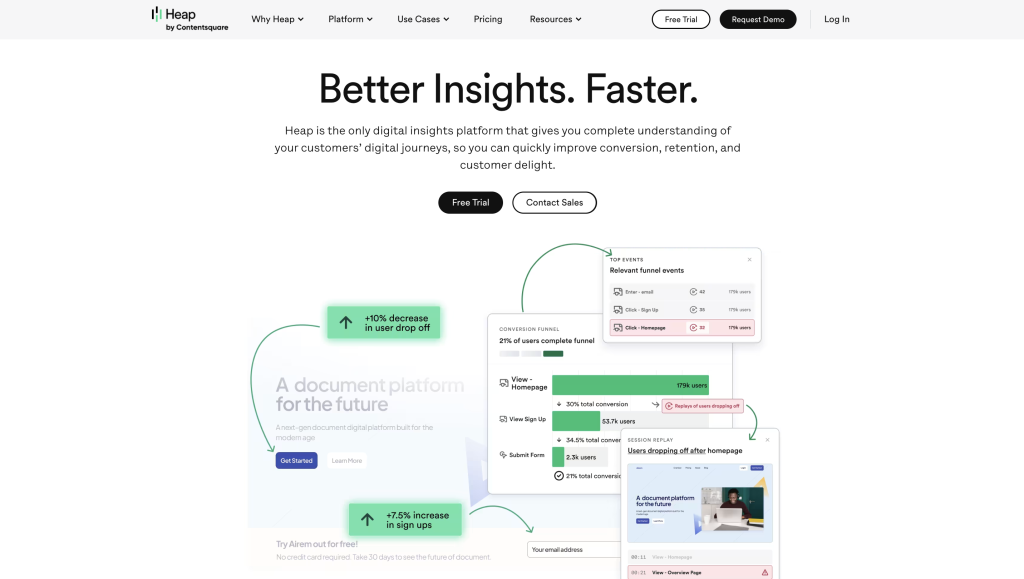
Heap: premium price, gated features
Heap’s selling point is automatic event capture—everything tracks without manual setup. But their free plan gives you six months of historical data.
The pro plan extends that to twelve months. Both plans cap your history, which kills long-term trend analysis. Heat maps and session replays? Those are add-ons. Engagement matrix and account-based analytics? Also gated.
- Price: ~$2,000-$5,000 per month (they won’t tell you publicly)
- Best for: Teams with complex needs
Heap is known for its automatic event capture, allowing teams to record user interactions and events automatically without manual setup.
Their free plan gives you six months of historical data. The pro plan extends that to twelve months, so both plans limit access to historical data, which can impact your ability to analyze long-term trends. Heat maps and session replays? Those are add-ons. Engagement matrix and account-based analytics? Also gated.
Heap offers solid functionality, but their pricing model breeds frustration. When a vendor hides their prices, I assume they’re negotiating different rates for everyone. That’s not transparency—that’s a red flag.
I don’t recommend Heap unless you have budget to burn and legal approval to negotiate custom contracts.
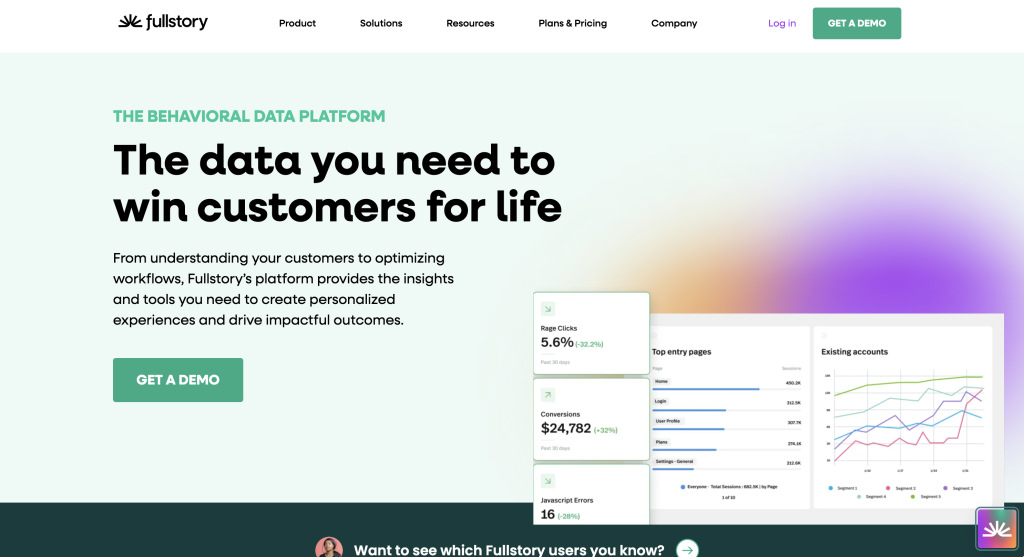
FullStory: built for developers who want every detail
FullStory tracks everything. Every click, every network request, every console log, and even form submissions. It’s a recording tool that developers swear by because you can see exactly what happened when something breaks.
FullStory also includes robust error tracking, capturing JavaScript errors and stack traces alongside session replays to help diagnose issues quickly.
- Price: Higher end (enterprise only)
- Best for: Dev teams debugging complex product issues
Here’s my take: if you’re a Full Story devotee, try Microsoft Clarity first. From what I’ve seen, Clarity does most of the same things without the enterprise price tag. I might not be Full Story’s biggest fan, but I know teams that can’t live without it.
I recommend Full Story when you’re debugging complex product flows and your dev team needs visibility into user sessions. Otherwise, explore cheaper alternatives.
Mixpanel: transparent pricing, solid execution
Mixpanel earns points for their growth estimator. You input your event volume, they show you the price. At 5 million events per month, you’re looking at about $650. Scale up to 30 million events and you hit $4,500 per month before enterprise kicks in.
- Price: ~$650 per month at 5 million events
- Best for: Product analytics without the enterprise bloat

Mixpanel is a comprehensive user analytics platform for tracking and analyzing user interactions. Their platform does web analytics, product analytics, and most of what you’d expect from a modern tool. Mixpanel also offers built-in A/B testing tools for experimentation and optimization.
The integrations aren’t my personal favorite, but they pull everything together in one location. Additionally, Mixpanel provides advanced data analysis features for uncovering trends and actionable insights.
The catch: no session recordings or heat maps. You’ll need to blend in another tool for qualitative insights.
I recommend Mixpanel when you want predictable pricing and strong product analytics without needing to see user sessions.
Amplitude: Mixpanel’s twin with different math
Amplitude and Mixpanel are nearly identical competitors. The key difference is how they count. Amplitude charges by monthly tracked users (MTUs), not events. At 5,000 MTUs, you’re at $124 per month. Scale to 50,000 MTUs and you’re roughly at the same price as Mixpanel.
- Price: ~$124 per month at 5K monthly tracked users
- Best for: Same use case as Mixpanel, different billing

As a leading product analytics platform, Amplitude offers robust tools for tracking and improving customer retention.
The benefit: they don’t care how many events each user fires, unless you hit some crazy outlier. Amplitude also excels at visualizing user journeys, helping teams understand the paths users take through a product. The functionality matches Mixpanel almost exactly. Same features, same positioning, same target customer.
I recommend Amplitude when your users generate lots of events per session. Otherwise, flip a coin between these two they’re that similar.
PostHog: maximum features, minimum price, more technical
PostHog has the most transparent pricing in the analytics space, but that transparency breeds complexity. Every feature product analytics, session replays, feature flags, data warehousing is priced independently. You build your own bundle.
- PostHog Pricing: Starts at $0. ~$200-400 per month with full features enabled
- Best for: Technical teams that want control and transparency

Here’s the math for our example: 1 million identified events, 5 million website events, session replays, and you’re still under $500 per month. They give you 5,000 free session recordings and 1 million rows of almost everything before charging you a dollar.
PostHog can also connect directly to your data warehouse for advanced analysis and seamless data flow.
I’ve never seen PostHog cost more than the competition. The trade-off is implementation time. PostHog targets technical users unapologetically. If you’re non-technical, expect a steeper learning curve.
I recommend PostHog when you want every feature at the lowest price and your team can handle a more hands-on setup.
Actually, I’ll recommend PostHog as the best product analytics tool in most cases. Features that make them unbeatable:
- Session Replay on a free tier
- Error tracking
- Surveys like Hotjar
- Custom Dashboards
- Custom audiences, groups and lists
- Funnels
- Custom Events (Frontend and Backend)
- CDP features: ingest your data in your CRM and workflows
Product Analytics tools comparison
| Tool | Price (5M events) | Session Recordings | Best For | Technical Level | Free Tier | Auto Event Capture | Setup Time |
|---|---|---|---|---|---|---|---|
|
Google Analytics
|
$0 | No | Marketing analytics | Low |
Yes (10M events) |
No | 1-2 hours |
|
PostHog
Best Value
→ Need implementation help?
|
$200-400 |
Yes (5K free) |
Technical teams, full feature set | High |
Yes (1M events) |
No | 4-8 hours |
|
Amplitude
|
$124-300 | No | Non-technical product teams | Low | Limited | No | 2-3 hours |
|
Mixpanel
|
$650 | No | Non-technical product teams | Low | Limited | No | 2-3 hours |
|
Heap
|
$2,000-5,000 | Add-on ($$$) | Teams valuing auto-capture | Low |
Yes (6 months data) |
Yes | 1-2 hours |
|
FullStory
|
Enterprise only | Yes | Developer debugging | Medium | No | No | 3-5 hours |
|
Microsoft Clarity
|
$0 |
Yes (unlimited) |
Session recordings only | Low |
Yes (unlimited) |
No | 30 minutes |
How to choose the Best Product Analytics tool for your team
Before you compare features or negotiate pricing, answer this: Are you technical or non-technical?
That single question determines which tool will work for your team. The best product analytics tool isn’t the one with the most features it’s the one your team will actually use.
Here’s the breakdown.
For non-technical marketers: Google Analytics or Mixpanel
If you’re running paid ads and need attribution data:
Start with Google Analytics. It’s free until you hit 10 million events per month. At that scale, you’re probably generating enough revenue to afford better tools anyway.
Google Analytics answers most marketing questions without requiring your engineering team’s involvement. Traffic sources, conversion rates, campaign performance—it’s all there. The interface is familiar. The documentation is everywhere.
The limitation hits when you need product-specific insights. User cohorts, retention analysis, feature adoption—Google Analytics makes these questions harder than they should be.
When you outgrow Google Analytics:
Move to Mixpanel. At 5 million events per month, you’re paying about $650. The pricing is transparent—no sales calls required. You input your event volume, they show you the cost.
Mixpanel lets non-technical teams answer product questions without writing SQL. You can track feature usage, build funnels, analyze cohorts. It doesn’t require constant engineering support.
I recommend Mixpanel over Amplitude for one reason: the UI feels more intuitive for non-technical users. They’re functionally identical, but Mixpanel’s interface clicks faster for most people I’ve worked with.
What you give up: Session recordings and heat maps. You’ll need to add another tool (Microsoft Clarity is free) if you want to see actual user sessions or learn more about setting up Google Tag Manager with analytics best practices.
For non-technical product teams: Amplitude or Mixpanel
If you’re a product manager who needs to understand feature adoption without bothering engineering every time you have a question, you’re choosing between Amplitude and Mixpanel. These tools are designed to help teams analyze customer behavior, making it easy to track user actions, journeys, and patterns without technical complexity.
They’re nearly identical. Same features, similar pricing, same target user. The difference is billing methodology.
Mixpanel charges by events. At 5 million events per month, you pay ~$650.
Amplitude charges by monthly tracked users. At 5,000 monthly tracked users, you pay ~$124.
Do the math for your specific usage—consider running a self-audit of your Google Analytics 4 (GA4) account to understand your event reporting accuracy. If your users generate lots of events per session, Amplitude costs less. If you have many users who generate few events, Mixpanel costs less.
Both integrate with most marketing and data tools. Minimal data preparation is required to get started, as both platforms connect and organize your data for analysis. Both let you build dashboards without SQL. Both lack session recordings (add a separate tool for that).
I recommend you pick based on pricing, not features. Calculate your actual costs with both, then choose the cheaper one.
For technical teams: PostHog (and it’s not close)
PostHog targets technical users unapologetically. That’s its strength and its limitation.
The value proposition: Every feature you need at a fraction of the cost.
At 5 million events per month with session recordings enabled, you’re paying $200-400 per month. Mixpanel and Amplitude charge $650-800 for less functionality. PostHog includes product analytics, session recordings, feature flags, and data warehousing—all independently priced, all transparent.
They give you 5,000 free session recordings per month. They give you 1 million rows of almost every feature before charging anything. I’ve never seen a PostHog bill exceed Mixpanel or Amplitude for equivalent usage.
The trade-off: Setup takes longer. The interface assumes you understand technical concepts. You’ll spend more time on implementation than you would with Mixpanel.
If your team is comfortable with APIs, custom events, and data infrastructure, PostHog saves you money while giving you more control.
I recommend PostHog for any team with engineering resources who want to customize everything. You’ll invest more time initially, but you’ll pay less every month forever.
What you give up: Nothing, really. You just need technical chops to set it up properly.
For debugging complex product issues: Full Story or Microsoft Clarity
Full Story is a session recording tool built for developers. It captures every click, every network request, every console error. When something breaks, you can replay exactly what happened.
Developers love it. I’m less enthusiastic about the price (enterprise only, no public pricing).
My recommendation: Try Microsoft Clarity first. It’s free. It does most of what Full Story does. If Clarity doesn’t solve your problem, then explore Full Story.
Full Story makes sense when you’re debugging complex product flows and your dev team needs deep visibility. Otherwise, you’re paying premium prices for features Clarity offers for free.
Best session recording tools for product analytics (2026)
Session recordings show you exactly what users do—not what your analytics says they should do. If you’re debugging UX issues or trying to understand why users drop off, you need recordings alongside your event data.
Best session recording tools ranked by value:
1. Microsoft Clarity: $0Free. Unlimited recordings. Heat maps included. No catch. If you’re budget-conscious, start here. The only limitation is it lacks the advanced filtering and search that enterprise tools offer.
2. PostHog: $0-200/month
5,000 free session recordings per month, then pay-as-you-go. The benefit over Clarity? PostHog ties recordings directly to your product analytics events, so you can jump from a funnel drop-off to the exact session that failed. For technical teams, this integration is worth the cost.
3. Heap: $2,000-5,000/month (add-on)
Session replay is an add-on to their already expensive product analytics platform. Unless you’re already paying for Heap, this makes no sense. You’re paying premium prices for something Clarity does for free.
4. FullStory: Enterprise pricing (undisclosed)
Built for developers who need every network request, console log, and error captured. The depth is unmatched—you can see stack traces alongside user sessions. But the price reflects it. Only worth it if Microsoft Clarity can’t solve your debugging needs.
My take: Start with Microsoft Clarity. If you need session recordings tied to product analytics events, upgrade to PostHog. Only consider FullStory if you’re debugging complex technical issues that require deep session inspection.
Typical cost of product analytics platforms (2026)
Here’s what you’ll actually pay based on your scale. These numbers assume you’re tracking events properly—not firing unnecessary data that inflates your bill.
Startup scale (under 100K events/month):
- Google Analytics: $0
- PostHog: $0-50/month
- Amplitude: $0-50/month (free tier)
- Mixpanel: $0-100/month (free tier)
- Heap: $2,000+/month (no free tier that matters)
Growing company (1-5M events/month):
- Google Analytics: $0
- PostHog: $200-400/month
- Amplitude: $120-300/month
- Mixpanel: $650-1,200/month
- Heap: $2,000-5,000/month
Established product (10M+ events/month):
- Google Analytics: $0 (or $50K+/year for GA360)
- PostHog: $800-2,000/month
- Amplitude: $2,000-8,000/month
- Mixpanel: $4,500-15,000/month
- Heap: $5,000-20,000+/month
The pattern is clear: PostHog costs less at every tier. Google Analytics is free but limited. Everything else sits in the middle, with Heap consistently the most expensive.
What drives your actual cost:
- Event volume (how many actions you track)
- User volume (MTUs for Amplitude)
- Add-ons (session replay, data warehouse exports)
- Contract negotiations (especially with Heap and FullStory)
Don’t trust marketing estimates. Calculate your actual event volume, plug it into each vendor’s pricing calculator, and compare real numbers.
PostHog vs Heap: which product analytics tool wins?
They target completely different users. PostHog wins on price and transparency. Heap wins on ease of setup for non-technical teams. But let’s break down the real differences.
Pricing transparency:
- PostHog: Every feature priced independently. Public calculator. No sales calls required.
- Heap: Hidden pricing. Requires demo and negotiation. Expect $2,000-5,000/month starting point.
Automatic event capture:
- PostHog: Manual event setup required. You decide what to track.
- Heap: Automatic capture of everything. Retroactive analysis without prior setup.
This is Heap’s main selling point—you can analyze past user behavior even if you didn’t set up tracking beforehand. For PostHog, if you didn’t instrument an event, you can’t analyze it historically.
Session recordings:
- PostHog: Included. 5,000 free recordings/month.
- Heap: Add-on. Extra cost on top of base platform.
Technical requirements:
- PostHog: Built for developers. Expect hands-on setup and configuration.
- Heap: Built for marketers. Less technical setup, more guided UI.
Feature flags and experimentation:
- PostHog: Included. Native A/B testing and feature flags.
- Heap: Limited. Basic experimentation available.
Data warehouse integration:
- PostHog: Direct connections to your warehouse. Export raw data easily.
- Heap: Available but less flexible than PostHog.
Historical data access:
- PostHog: Unlimited history on paid plans.
- Heap: Free tier = 6 months. Pro tier = 12 months. Both limit long-term analysis.
My verdict:
If you’re non-technical and value automatic capture over cost, Heap makes sense—but you’re paying a premium for convenience. The automatic event capture is genuinely useful when your tracking strategy isn’t mature.
If you’re technical or budget-conscious, PostHog wins. You’ll invest more setup time, but you’ll save thousands monthly. At 5 million events with recordings enabled, PostHog costs $200-400. Heap costs $2,000-5,000 for similar functionality.
The gap widens as you scale. Heap’s pricing model penalizes growth. PostHog’s transparent pricing lets you predict costs accurately.
Product analytics tools under $500 per month
If your budget caps at $500/month, you have more options than you think. You’re not sacrificing core functionality—you’re just eliminating enterprise bloat.
Tools that fit under $500/month (at typical scale):
PostHog: $0-400/month
At 5 million events with session recordings: ~$200-400/month. Includes product analytics, session replay, feature flags, surveys, and A/B testing. Best value in this price range.
Amplitude: $124-400/month
At 5,000-15,000 monthly tracked users: $124-400/month. Strong product analytics, no session recordings. Pricing depends on your user count, not event volume.
Mixpanel: $0-400/month
At 0-3 million events: $0-400/month. Above 5 million events, you exceed $500 quickly. Good for smaller scale or low-event products.
Microsoft Clarity: $0
Unlimited session recordings and heat maps. Zero cost. No analytics depth, but pairs well with Google Analytics for free qualitative insights.
Google Analytics: $0
Free forever (unless you need GA360). Covers marketing analytics well, struggles with product-specific insights.
Tools that DON’T fit under $500/month:
- Heap: Minimum ~$2,000/month. Their free tier is too limited for real product analytics work.
- FullStory: Enterprise-only pricing. Starts well above $500/month.
- Mixpanel at scale: Once you hit 5+ million events, you’re paying $650-1,200+/month.
How to choose the best product analytics tool for your team
Before you compare features or negotiate pricing, answer this: Are you technical or non-technical?
That single question determines which tool will work for your team. The best product analytics tool isn’t the one with the most features—it’s the one your team will actually use.
Here’s the breakdown.
For non-technical marketers: Google Analytics or Mixpanel
If you’re running paid ads and need attribution data:
Start with Google Analytics. It’s free until you hit 10 million events per month. At that scale, you’re probably generating enough revenue to afford better tools anyway.
Google Analytics answers most marketing questions without requiring your engineering team’s involvement. Traffic sources, conversion rates, campaign performance—it’s all there. The interface is familiar. The documentation is everywhere.
The limitation hits when you need product-specific insights. User cohorts, retention analysis, feature adoption—Google Analytics makes these questions harder than they should be.
When you outgrow Google Analytics:
Move to Mixpanel. At 5 million events per month, you’re paying about $650. The pricing is transparent—no sales calls required. You input your event volume, they show you the cost.
Mixpanel lets non-technical teams answer product questions without writing SQL. You can track feature usage, build funnels, analyze cohorts. It doesn’t require constant engineering support.
I recommend Mixpanel over Amplitude for one reason: the UI feels more intuitive for non-technical users. They’re functionally identical, but Mixpanel’s interface clicks faster for most people I’ve worked with.
What you give up: Session recordings and heat maps. You’ll need to add another tool (Microsoft Clarity is free) if you want to see actual user sessions. If you’re also tracking events and need to visualize website trends in dashboards, learn about setting up Google Tag Manager with analytics best practices.
For non-technical product teams: Amplitude or Mixpanel
If you’re a product manager who needs to understand feature adoption without bothering engineering every time you have a question, you’re choosing between Amplitude and Mixpanel. These tools let you analyze customer behavior—track user actions, journeys, and patterns—without technical complexity.
They’re nearly identical. Same features, similar pricing, same target user. The difference is billing methodology.
Mixpanel charges by events. At 5 million events per month, you pay ~$650.
Amplitude charges by monthly tracked users. At 5,000 monthly tracked users, you pay ~$124.
Do the math for your specific usage. If your users generate lots of events per session, Amplitude costs less. If you have many users who generate few events, Mixpanel costs less.
If you’re unsure about your event volume accuracy, consider running a self-audit of your Google Analytics 4 (GA4) account to understand your event reporting before choosing a billing model.
Both integrate with most marketing and data tools. Minimal data preparation is required to get started, as both platforms connect and organize your data for analysis. Both let you build dashboards without SQL. Both lack session recordings (add a separate tool for that).
I recommend you pick based on pricing, not features. Calculate your actual costs with both, then choose the cheaper one.
For technical teams: PostHog (and it’s not close)
PostHog targets technical users unapologetically. That’s its strength and its limitation.
The value proposition: Every feature you need at a fraction of the cost.
At 5 million events per month with session recordings enabled, you’re paying $200-400 per month. Mixpanel and Amplitude charge $650-800 for less functionality. PostHog includes product analytics, session recordings, feature flags, and data warehousing—all independently priced, all transparent.
They give you 5,000 free session recordings per month. They give you 1 million rows of almost every feature before charging anything. I’ve never seen a PostHog bill exceed Mixpanel or Amplitude for equivalent usage.
The trade-off: Setup takes longer. The interface assumes you understand technical concepts. You’ll spend more time on implementation than you would with Mixpanel.
If your team is comfortable with APIs, custom events, and data infrastructure, PostHog saves you money while giving you more control.
I recommend PostHog for any team with engineering resources who want to customize everything. You’ll invest more time initially, but you’ll pay less every month forever.
What you give up: Nothing, really. You just need technical chops to set it up properly.
For debugging complex product issues: Full Story or Microsoft Clarity
Full Story is a session recording tool built for developers. It captures every click, every network request, every console error. When something breaks, you can replay exactly what happened.
Developers love it. I’m less enthusiastic about the price (enterprise only, no public pricing).
My recommendation: Try Microsoft Clarity first. It’s free. It does most of what Full Story does. If Clarity doesn’t solve your problem, then explore Full Story.
Full Story makes sense when you’re debugging complex product flows and your dev team needs deep visibility. Otherwise, you’re paying premium prices for features Clarity offers for free.
The enterprise versus non-enterprise divide
There’s an invisible line in analytics tooling. Heap, Mixpanel, and Amplitude chase non-technical marketers and product managers. PostHog and Full Story target technical users who want more control.
This isn’t about features—it’s about philosophy. Non-technical tools abstract away complexity. Technical tools expose it and let you customize everything.
Know which side of that line you’re on before you sign a contract.
Conclusions: Choose the best product analytics tools
Answer three questions:
- Is your team technical or non-technical?
- What’s your actual event volume and user count?
- Do you need session recordings?
Your answers determine your tool:
- Non-technical + low volume = Google Analytics
- Non-technical + higher volume = Mixpanel or Amplitude
- Technical + any volume = PostHog
- Need session recordings = Add Microsoft Clarity or Full Story
Don’t overthink this. The best analytics tool is the one your team will actually implement and use consistently.
If you want help auditing your current setup or choosing the right tool for your team structure, reach out I’m happy to walk through your specific situation.


