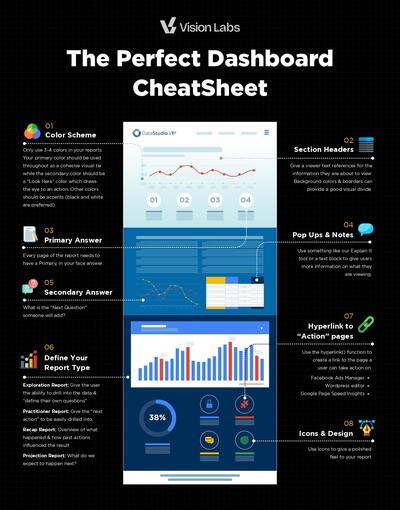
Looker Studio – formerly Google Data Studio – lets users convert data into reports and dashboards. It first hit the market in 2016 as part of the Google Analytics 360 suite, and has been getting more pupolar ever since.
👉 But how does Looker Studio compare to other data analytics and visualization platforms? 🤔 Here’s a quick rundown of some of the key differences between them.
⚔️Looker Studio vs. Power BI ⚔️
Power BI is Microsoft’s interactive data visualization platform. Released in 2014, it’s made for business intelligence (hence the BI in the name) and offers businesses tools that analyze, aggregate, and visualize data. 👀

Cost
💰Looker Studio is currently FREE where Power BI can cost. Power BI’s pricing is based on the number of active users, and the cost goes up as you add more. Their plans also offer more advanced features like data modeling and exploration – which can raise prices even higher. 💸
In contrast, Looker Studio is FREE where power BI has a free version as well that is limited (Power BI Desktop) that lets you create and view reports and dashboards. The paid version (Power BI Pro) starts at a lower cost and goes up based on the number of users. ⬆️
👉 Note: If you have a Microsoft 365 or Dynamics 365 subscription, you may already have Power BI Pro or Power BI Premium licenses. Check to see if that’s included in the subscription.
User Interface (UI) Comparison ⚖️
Looker Studio has a modern, intuitive UI designed for data exploration and analysis. You get a wide range of data visualization options and create custom calculations and relationships. The UI focuses on data exploration and allows users to easily navigate, filter, and drill down the data.🪛
Power BI, on the other hand, has a more traditional and visually-oriented UI that’s for creating interactive reports and dashboards. It has many pre-built visualizations and lets users easily drag and drop data fields to create charts and graphs.
The UI is focused on data visualization and allows quick creation and sharing of interactive dashboards. 📊
Speed ⏩
The speed of Looker Studio and Power BI can vary depending on several factors, including the size of the data being analyzed, the complexity of the calculations and visualizations being performed, and the resources available on the server or device being used.
Bonus tip is that Looker Studio & Big Query can utilize BI engine & make reports that are lighting fast
Visualization Types and Customization
📈 Looker Studio provides a range of visualization options, including advanced charts and diagrams you can customize to specific use cases. It also lets you create custom visualizations using LookML, most useful for organizations that have detailed data visualization needs.
Looker’s data exploration and data modeling capabilities allow a more in-depth analysis of data, making it easier to discover insights and patterns.
Check out our free visualizations on the tools page
📉 Power BI focuses more on creating interactive dashboards and reports. It offers many pre-built visualizations and allows users to easily drag and drop data fields to create charts and graphs.
Power BI also has features like automatic data discovery, which makes it a breeze to identify trends and patterns in the data.
🥊Looker Studio vs. Tableau🥊
Tableau is an interactive data platform that enables users to dig deeper into their data to get critical insights. Here’s how it stacks up against Looker Studio.

Cost 💵
Tableau’s pricing is a per-user, per-month subscription model. Different pricing tiers are based on the level of functionality required.
The pricing starts at $42 per user per month for Tableau Creator, which includes basic data visualization and collaboration capabilities. The most advanced level, Tableau Server & Tableau Online, starts at $35 per user/month and goes up to $70 per user/month.
Looker Studio is FREEEEEEEEEE
UI 🧑💻
Tableau’s UI is designed for data analysts and business intelligence professionals. It has a drag-and-drop interface that allows users to quickly create interactive visualizations and dashboards. The interface is intuitive and easy to use, and it includes a wide range of built-in visualizations and chart types.
The main difference between the two platforms is that Looker’s UI focuses on simplifying creating and sharing data models rather than just visualizations. This allows users to leverage the data modeling capabilities of the platform to create a more flexible and powerful data analysis environment.
Speed 🚄
The speed of Looker and Tableau can vary. It mostly depends on things like the size and complexity of the data set, the number of users, and the hardware and network infrastructure. In general, both Looker and Tableau are designed to handle large and complex data sets, and they can perform complex calculations and queries quickly.
Visualization Types and Customization 📊
👉 Tableau provides numerous built-in visualizations like bar charts, line charts, scatter plots, and maps. 🗺️ It also offers more advanced visualization types like tree maps, box plots, and scatter plots with groups. Plus, Tableau has a range of data connectors, making it easy to join it to several data sources.🧾
👉 Looker also offers a range of built-in visualizations for creating and sharing data models. This lets users leverage its data-modeling capabilities to create a more flexible and powerful 💪 data analysis environment.
📶 While both platforms offer several visualization and customization options, Tableau’s focus is more on creating interactive visualizations, while Looker works on creating and sharing data models.

In Conclusion: Which Tool is Best? 🤨💭
✅ All the tools we discussed allow you to implement a high degree of customization. There’s no one-size-fits-all solution for data visualization tools, so it’s best to explore all your options before choosing one to work with. Need the perfect solution for your business?
Mediauthentic can help you wade through the overwhelming pool of data and options to help grow your business with less stress. Reach out to us today!
