JJ Reynolds is the founder of Vision Labs, a white-glove data agency specializing in custom measurement systems and real-time marketing dashboards. Having worked with startups to multi-billion dollar companies, he creates bespoke reporting solutions that help businesses turn data into decisions. His expertise in media buying, PPC, and analytics enables companies of all sizes to make smarter, data-driven choices.
Most teams measure what visitors did. A strong web analytics strategy measures what you designed to happen. The Bow Tie framework, in 6 steps + a canvas.
Use Data As Your Competitive Advantage
Learn exactly how VisionLabs can fix your data setup, improve tracking, and build a measurement plan based on your goals.
Where does web analytics actually fit? Half a dozen of our clients asked some version of that question in a single week, so my team sat down and built the answer out properly.
This article is that strategy session. I’m going to give you the framework we draw at Vision Labs (we call it the bow tie), the six steps to turn it into a working web analytics measurement strategy, and a one-page canvas you can fill in for your own site. We run measurement across GA4, GTM, BigQuery, and PostHog for companies doing anywhere from $1M to $1B in revenue, and this is the exact thinking we start every engagement with: figure out which visitor actions become revenue, then measure whether the site is producing those actions.
What is a web analytics measurement strategy?
A web analytics measurement strategy is a plan that defines what you want visitors to do on your site, how you will know whether they did it, and where web analytics hands off to your product and sales data. It is not a list of metrics.
That last sentence matters, because most guides treat a web analytics strategy as metric selection. Pick goals, pick KPIs, build a dashboard, done. The classic version of that thinking is Avinash Kaushik’s Digital Marketing and Measurement Model, and it’s still worth reading. But there are two questions those step lists never answer, and they’re the two questions that decide whether your data is usable:
Where does web analytics end? (Spoiler: much earlier than most dashboards admit.)
What did you design the site to make happen? (If you never designed anything, there’s nothing to measure. There’s only traffic.)
The bow tie answers the first question. The dam, which we’ll get to, answers the second.
The bow tie: where web analytics starts and ends
Picture a bow tie: a wide left wing, a knot in the middle, a wide right wing.
The left wing is everything that happens before someone tells you who they are. At the far edge you have off-platform activity: Facebook impressions, Google Ads views, a number some API hands you. Then people land on your site, and the funnel narrows through four stages:
Landing page views. They showed up.
Engagement. They actually consumed something.
Intent. They looked at the pages people look at right before they raise their hand: pricing, contact, a signup page.
Contact creation. They filled the form, booked the call, started the trial.
That left wing is web analytics territory, and it has one defining trait: it’s mostly anonymous. You’re dealing with cookie blockers, consent banners, and browsers that forget visitors on purpose. That’s fine. You don’t need to know who is on the left wing. You need to know how many are moving through each stage.
The knot is the identity moment. The second someone submits a form and effectively says “I consent, I think you’re a good company, and I want what you’re selling,” they stop being a session and become a person. Now there’s a join key: an email address, a database ID, a phone number, whatever floats your boat. That key is what ties the whole bow tie together.
And the very first thing on the right wing is onboarding. I don’t care if you sell an info product, a high-ticket service, or B2B software: something happens the second after the email is submitted, and it deserves measurement. At Vision Labs, when you submit a lead magnet form you hit a thank-you page with my face on it, walking you through our process. I want to know how many people watch that video. That’s onboarding.
From there the right wing widens back out: trials, adoption, upgrades, seats, expansion. Call it product analytics if you’re product-led, revops or sales analytics if you’re sales-led. The mechanics differ, the shape doesn’t: they use it more, and you make more money.
Here’s the rule that keeps your stack sane, and it’s the sentence I’d tattoo on every dashboard: web analytics is everything left of the knot. Most broken measurement setups we audit got that way because someone kept shoving right-wing questions (retention, feature adoption, LTV) into a left-wing tool. That conflation is why the dashboards feel like mush.
Bow tie stage
The question it answers
Example metrics
Side of the knot
Off-platform
Are we reaching anyone?
Ad impressions, reach
Left (context)
Landing page views
Are they arriving?
Sessions, entrances by page
Left
Engagement
Are they consuming?
Scroll depth, time on key pages, video plays
Left
Intent
Are they considering?
Pricing page views, contact page views
Left
Contact creation
Did they convert?
Form fills, booked calls, signups
The knot
Onboarding
Did they activate?
Thank-you video watch rate, first login
Right
Adoption and expansion
Are they growing?
Feature usage, retention, revenue per account
Right
Why shouldn’t you build your strategy around attribution?
Because one user’s backwards path is not a strategy. Knowing exactly what a single converted visitor did tells you almost nothing about what the next thousand visitors will do.
Here’s the trap, and every company falls into it at some size, whether you’re doing $1M, $100M, or $1B in topline revenue. A contact gets created. Someone opens the CRM, picks a shiny new lead, and asks the question: what did they do? So you trace it backwards. Rose viewed the landing page, engaged with a guide, hit the pricing page, filled the form. Fascinating. And then the team quietly starts building the whole marketing plan around Rose’s zigzag.
That’s fishing like this: you catch a fish at 11:49 p.m. in Lake Ontario, at these exact coordinates. You mark the calendar. Next year, same time, same spot, you drop your line right where the fish was and wonder why nothing bites. The water temperature changed. The lake changed. The fish moved. Reconstructing one fish’s journey through a giant lake is trivia, not strategy.
What works is the opposite move. You don’t chase the fish; you build a dam on the river. You shape the water so the majority of fish, the majority of the time, flow into one narrow channel, and then you stand at that channel and catch fish after fish. When it works, you don’t ask “where did that one fish wander?” You ask “is the dam holding? Should we make it bigger?”
In measurement terms: stop asking what did they do? and start asking what were we trying to get them to do, and did they do it? That flip is the entire strategy. It’s the same thinking behind the measurement framework we run with clients, and it’s what makes your numbers decision-ready instead of merely interesting.
The 2026 reality makes this flip non-optional:
Consent walls mean a growing share of visitors are never individually trackable in the first place.
Cookie blockers snap user journeys in half, so backwards paths are fiction for a chunk of your traffic anyway.
AI assistants now send real buyers who show up as “direct” with no journey at all. We see it on our own site.
Aggregate flow through a funnel you designed survives all three. Per-user path reconstruction does not. Design forward, measure the flow.
Build your web analytics measurement strategy in 6 steps
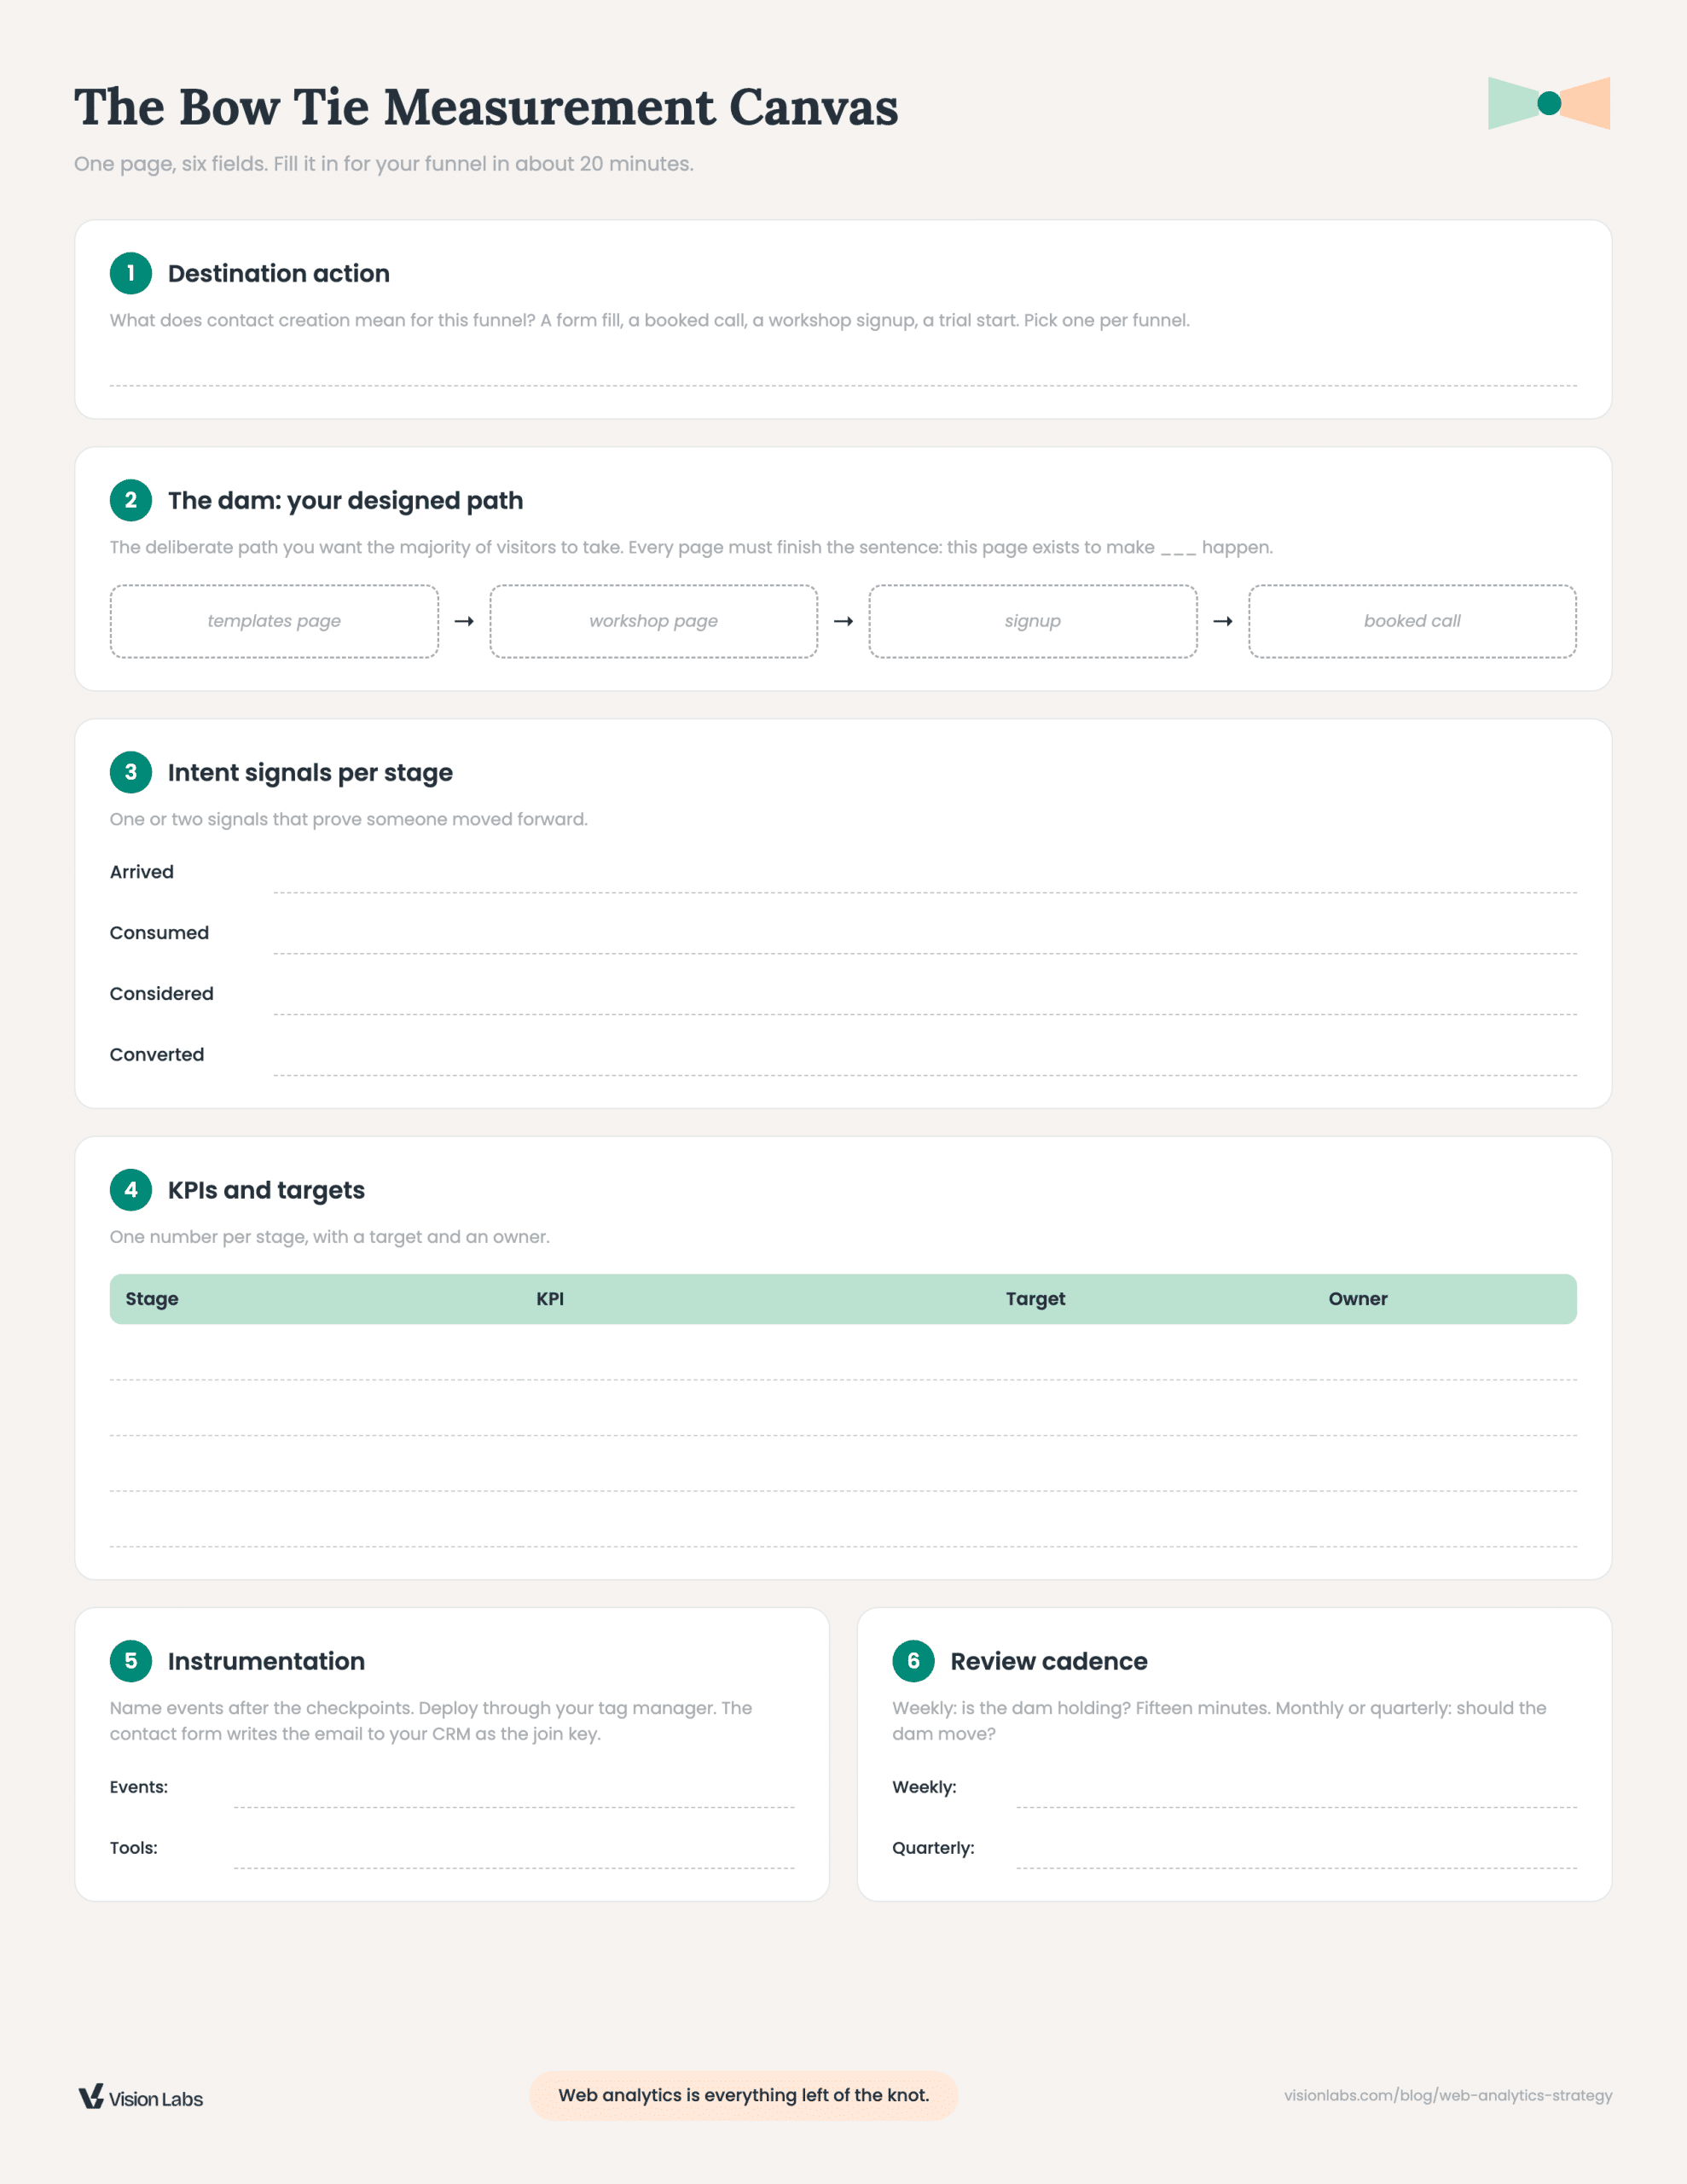
Decide what contact creation means for this funnel: a form fill, a booked call, a workshop signup, a trial start. Pick one per funnel. This is the spot on the river where you’ll stand and fish, and everything else in the strategy exists to move people toward it. If everything on your site is a conversion, nothing is.
Step 2: Design the dam
Lay out the deliberate path you want the majority of visitors to take. On our own site one path looks like this: a templates page built to drive engagement, which points to our workshop page, which drives a signup, which leads to a booked call. Four pages, one job each. That’s the test, by the way: every page on the path should finish the sentence “this page exists to make ___ happen.” If you can’t finish the sentence, the page is decoration.
Step 3: Pick the intent signals
For each stage of the left wing, choose the one or two signals that prove someone moved forward: they arrived (landing view), they consumed (engagement on the pages that matter), they considered (pricing or contact page view), they converted (the destination action). These micro conversions are checkpoints along the dam. You are not trying to track everything a visitor could possibly do; you’re verifying flow between checkpoints.
Step 4: Set KPIs and targets per stage
Now, and only now, pick your web analytics KPIs: one number per stage, with a target and an owner. The standard you’re holding the funnel to comes straight from the dam logic: are the majority of visitors, the majority of the time, reaching the place we built for them?
One warning while you’re here: impressions live at the far left edge, off-platform. They’re context, not success. The moment an impression number shows up in the same view as your conversion checkpoints, someone will average them together and call it insight. Keep the edges of the bow tie honest.
Step 5: Instrument it
This list of stages, signals, and KPIs is your web analytics measurement plan, and turning it into a GA4 measurement plan (or a PostHog one, the logic is identical) is now mechanical instead of philosophical. Name your events after the checkpoints. Deploy through your tag manager. Make sure the contact form writes to your CRM with the email as the join key, because that knot is where the left wing has to hand off cleanly to the right. Then test the whole path before you trust a single number in production. If you’re choosing tooling, here’s what PostHog is and how we set it up, and how we wire GA4 into BigQuery when clients need raw data.
Step 6: Review on a cadence
Weekly, check whether the dam is holding: flow per stage against target, fifteen minutes. Monthly or quarterly, ask whether the dam should move: new offer, new path, new destination action. What you should not do is respond to every soft week by adding another dashboard. Fewer reports, pointed at the checkpoints, beat a wall of charts nobody owns.
Download: the Bow Tie Measurement Canvas. One page, six fields, the exact worksheet version of this process. Fill it in for your funnel in about 20 minutes.
What’s the difference between web analytics and product analytics?
Web analytics measures anonymous visitors before they tell you who they are; product analytics measures identified users inside your product; and an email or database ID is what ties the two sides together. In bow tie terms: web analytics is the left wing, product analytics is the right wing, and the knot is the handoff.
PostHog’s docs have a solid technical comparison of the two if you want the feature-level view. The strategic view is about which questions you’re asking. “Which channel, which page, which message is moving people toward contact creation?” is a left-wing question. “Which features do our best customers adopt, and which cohorts retain?” is a right-wing question. If you’re evaluating right-wing tooling, we tested the best product analytics tools in production.
This split is also why marketing and product teams fight about analytics. Marketing lives in unknown unknowns, building dams for anonymous traffic it can barely see. Product tags every fish in the pond and studies how the majority behave once they’re swimming inside: left side or right side, deep or shallow. Both are doing measurement correctly. They’re just standing on opposite wings of the bow tie, and the fight usually dissolves the moment both teams can point at the knot and agree on the join key.
Common questions about web analytics measurement strategy
What should a measurement plan include?
Six things: your destination action (contact creation event), the designed path to reach it, one or two intent signals per stage, a KPI and target per stage, the event names and tools that instrument each checkpoint, and a review cadence. That’s the whole canvas. If a metric doesn’t map to a checkpoint, it doesn’t go in the plan.
Is GA4 enough, or do you need product analytics too?
If your questions live left of the knot (traffic, pages, conversion to contact), GA4 or any web analytics tool is enough. You need a product analytics tool the day your questions move right of the knot: logged-in behavior, feature adoption, retention. Don’t pay product analytics prices to answer anonymous-traffic questions.
How often should you revisit your web analytics strategy?
Every time the funnel itself changes: a new lead magnet, a new landing page, a new offer, a new destination action. Quarterly at minimum. The weekly review checks whether the dam is holding; it’s not the moment to redesign the river.
When to bring in a measurement partner
Bring in help when instrumenting the bow tie is costing your team more than the answers are worth, or when nobody owns the knot and leads vanish somewhere between the form and the CRM. That handoff failure is the single most common thing we find in audits.
This is what we do at Vision Labs: audit what’s actually firing, implement the bow tie across GA4, GTM, BigQuery, and PostHog, and then iterate with your team. Here’s the 90-day process, and if you’re comparing options first, we published an honest look at the top web analytics agencies, including where each one fits best.
If any inkling in your body is saying “I don’t actually know what’s happening between our ads and our CRM,” schedule a strategy call. Tell us where you are and where you want to be. We’ll tell you whether you need a dam, a better knot, or just fewer dashboards.
Black Friday Offer🔥 Get your data audit.
Normally $2,500—this week only $97. We’ll audit your GA4 stack and jump on a live session to prioritize fixes.