


When companies come to us they usually have a very specific problem.
- “Our Google Analytics Revenue is WAY OFF from actual revenue”
- “We are advertising on Google, Facebook, and Tik Tok, & all are reporting profitability but it’s not true”
- “We have no idea how people are engaging with our funnel”
Once that problem is solved, they then ask “how can we continue working together?”. This is how & why going beyond a (Fix This) contract is worth it for our full time measurement clients.
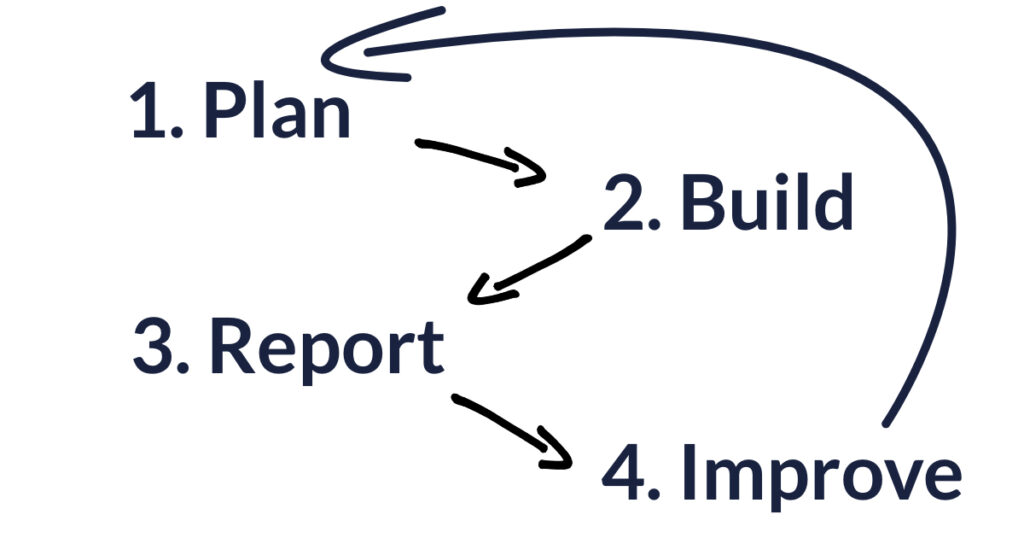
The Measurement Process
Our strategy is simple.
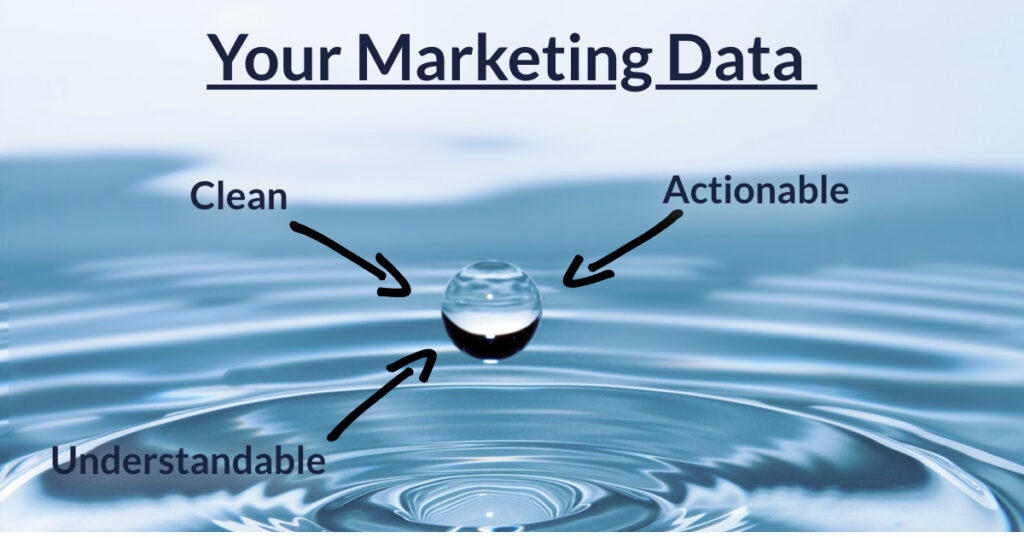
We work with clients/partners to constantly improve actionable data!
We Stick within the Google Marketing Stack: Google Analytics, Google Data Studio, & Google Tag Manager. But will manage tags for just about any platform.
Phase 1: Plan & Find Your Easy Wins!
We understand the first steps of any arrangement are scary. This is why we front load a standard audit & implementation process. This allows your account to begin collecting much better information from your existing implementation.
These Steps Usually Include:
- Data layer implementation to understand how onsite events are consistently tied together.
- Filters & data clean manipulations (within Google Analytics).
- Optimize Views, Goals, & Event Strategy
- UserID Measurement (Separating active members from new acquisitions)
- UserID Actions (What actions are existing users supposed to take?)
- Custom dimensions & metrics for custom answers
- URL parameter management (We have custom templates and trainings)
This first phase is like dating, we are pulling out all of the stops to make sure you love working with us. We will most likely hop on a call every week to make sure we understand your exact pain points.
Phase 2: Build & Implement Journeys and Site Level Structure
Once we get our easy wins. Clients begin to see the “Light at the end of the tunnel” and that is amazing. But there is still lots to do. We next want to level up your implementations.

We use journeys to identify your intended path for users. Instead of asking “What did they do?” we ask “What did we want them to do?” Which helps us identify the purpose of your site’s pages & experience.
This Usually Includes:
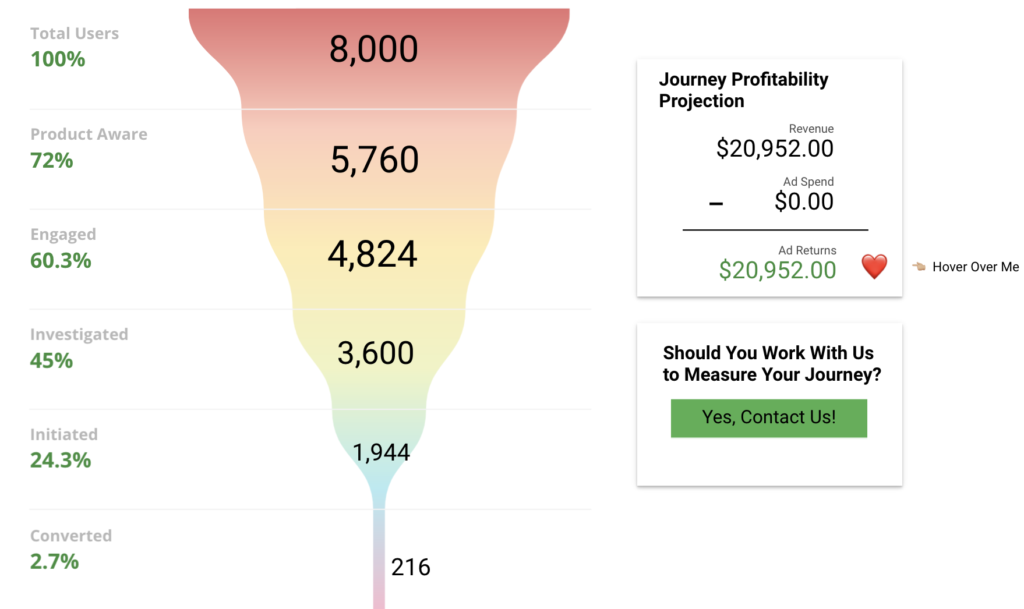
- Identify & begin optimizing a top-down journey & GA Implementation. Like this
- Build out visualizations based on new data. Similar to these breakdowns
- Phase in new questions from marketing teams.
- We are trying to do X, how can we improve Y?
- Create a single source of truth across all departments.
- Landing page & core decision page Layered Journey implementations.
- Begin asking about results & how at each stage.
Phase 3: Optimize Core Reporting Within Data Studio
Once you have your data you need to know the actions to take. Instead of the traditional rows & columns, we like to build windows into the data using Google Data Studio.
- Data Studio creation for department-level & executive reporting.
- Everyone should know their numbers from the CMO to the Email Marketer.
- Data Studio load speed optimizations (make the reports load as fast as possible)
- Identify if other sources are needed (Facebook Ads, Google Sheets, Supermetrics Connectors, etc)
Phase 4: Improvements, Optimizations, & Maintenance
Phase 4 is where we start truly becoming your partner in your measurement journey. As we uncover more improvements your team will have more questions.
We want to make sure that you are taken care of so our shared slack channel allows us to work alongside your company as you pivot & grow.
Ongoing Improvements Look Like
- There will be improvements to be made as new questions are asked.
- We want to keep your reports clean, focused, and actionable while improving at every step.
- Having tag management, data warehousing & dashboarding under a single roof allows us to revisit every step of the process and be super nimble along the way.
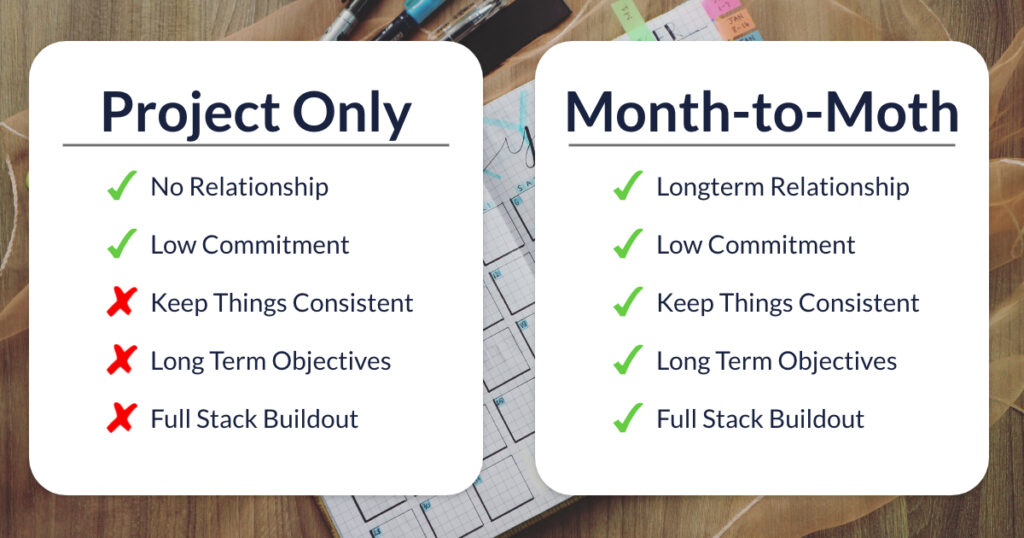
Why Month-to-Month Works
Managing Analytics, Tag Management, & Actionable Visualizations are very specific skills that most people do not have by default. That’s ok. If you were to hire someone internally salaries for this usually range from $120,000 to $180,000 then factor in benefits, PTO, and all that jazz. Needless to say. It’s expensive.
- Salaries hover around $140,000/Year
- Retainers range from $2k to $7k per month. (way less)
Our monthly retainers cover everything Google Analytics, Google Tag Manager, & Google Data Studio Visualizations.
Building a new website? No problem, we will make sure everything carries over.
Adding new funnels? No problem, we can set that up for you & visualize it.
Have a specific question? Let’s hop on a call to see if we already have that data or need to phase it in.
WE TAKE CARE OF OUR CLIENTS!
So if you are about to partner with a company to manage you analytics collection, storage, and visualization. What do you get?
Well, you get our processes & comfort knowing that there is a “Bat Phone” to call someone if things change.
If this sounds like you, let’s hop on a discovery call!


