


Staying ahead of the competition requires more than just intuition and guesswork. To truly understand your website’s performance, you need precise insights that you can ACT on.
In this blog post, we’ll take you on a journey into the world of quickly identifying SEO content that is on the brink of ranking, exploring how to harness the combined power of SEO and Google Analytics 4 (GA4) data through Looker Studio.
Getting Started: Connecting to Your Data Sources ????
Before you dive into creating a seamless SEO + GA4 API report in Looker Studio, it’s essential to establish a connection with your data sources.
Looker Studio boasts a wide range of data integration capabilities, and with the right setup, you can have your SEO data and GA4 data in one central location and gain a holistic perspective of your online presence.
Inputs & Accounts
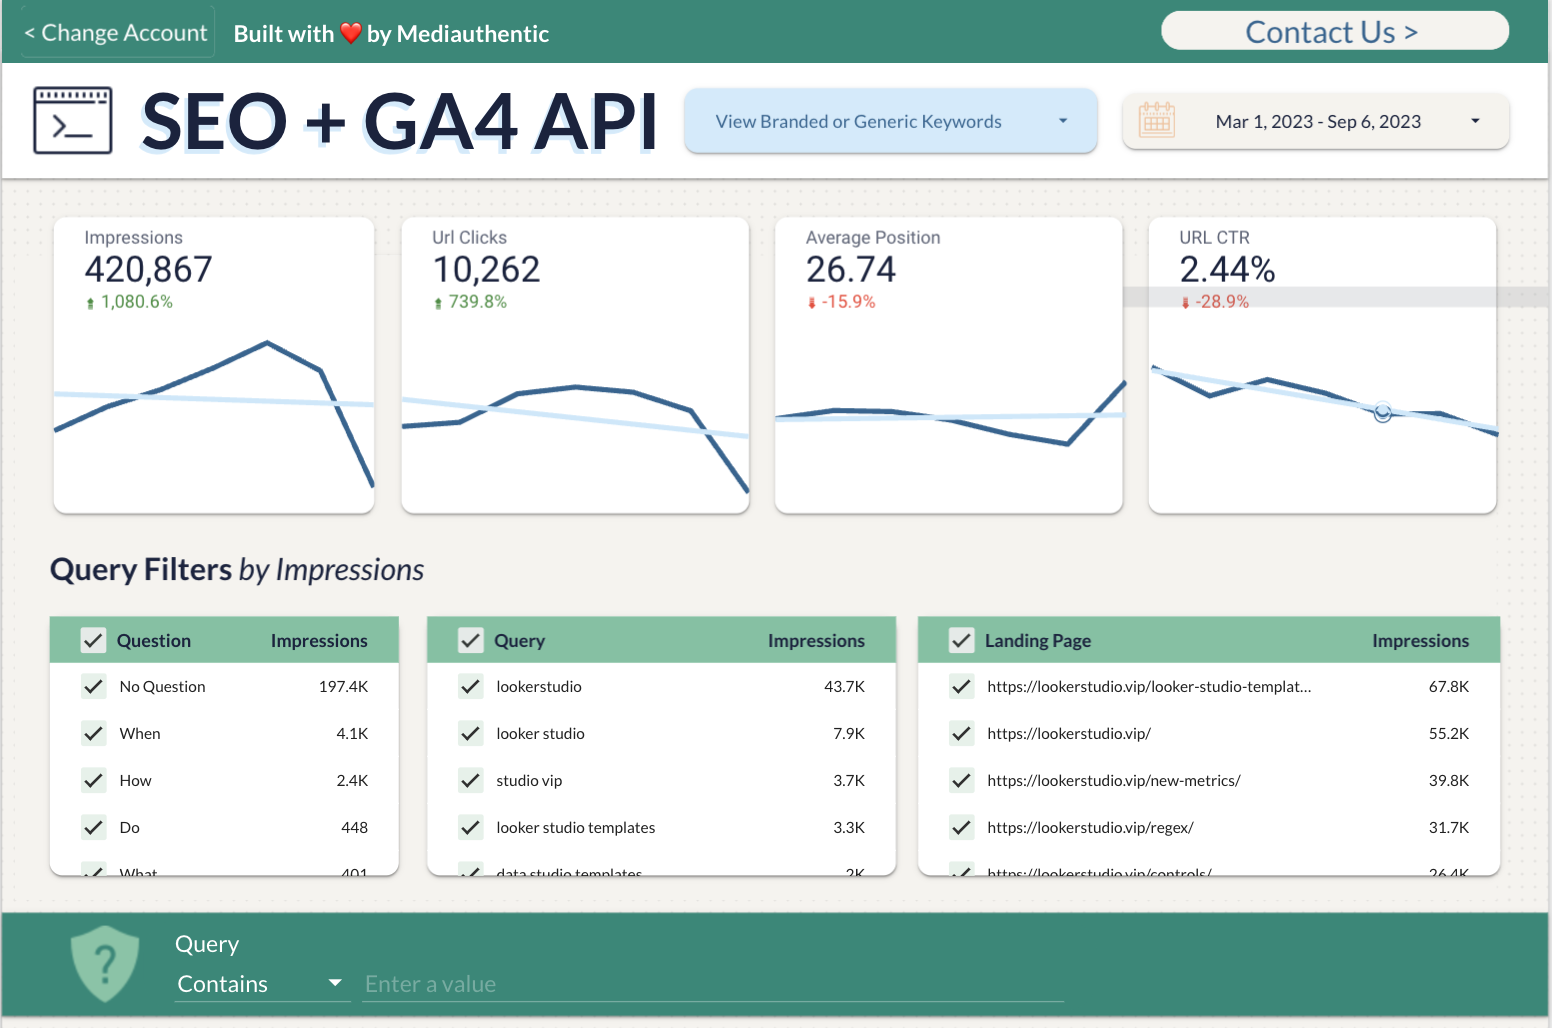
In this report, we harness Looker Studio’s data controls to enable users to input their distinct Search Console and GA4 data sources. The “Inputs & Accounts” page of this report prominently features these two controls.
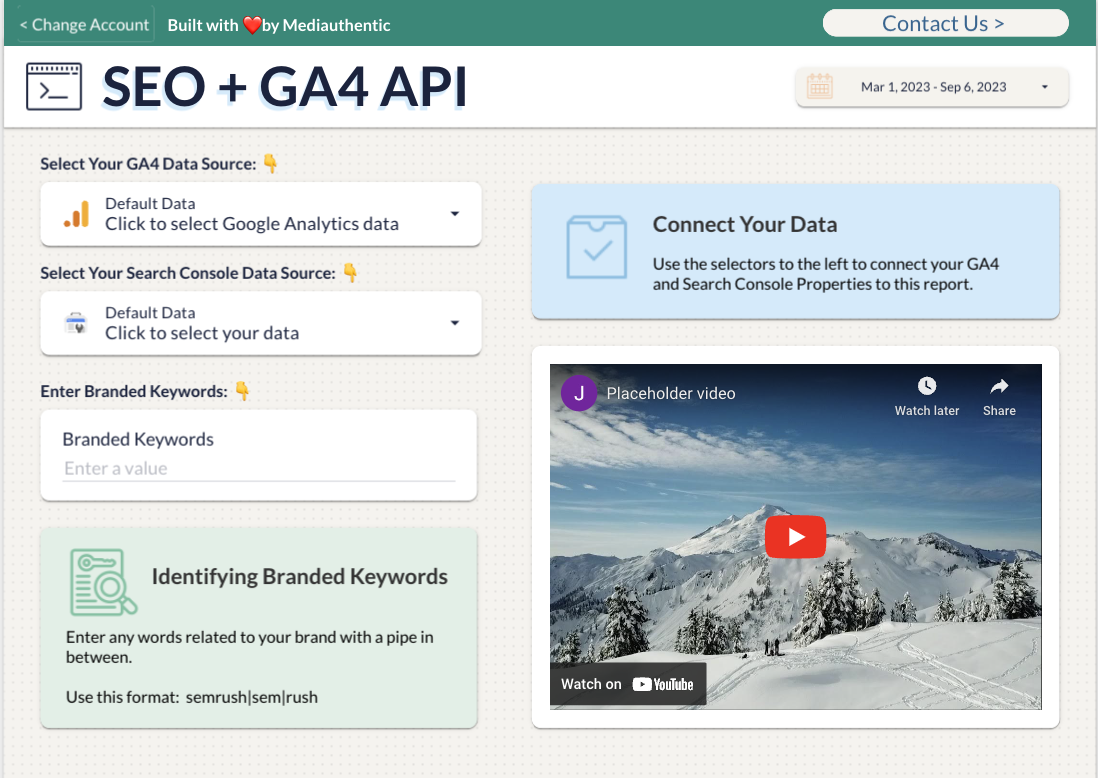
To ensure these controls work across the entire report, they must be set to the report level. You can achieve this by right-clicking on the controls and selecting the “Make Report Level” option.
One challenge you might encounter is that, by making these controls report-level, they will become visible on all pages.
Fortunately, the solution is straightforward. We employed a rectangle, matching the background color, to conceal these controls in the rest of the report.
Branded Keywords
On the Inputs & Accounts page of the report, you’ll also find an input control dedicated to Branded Keywords. Branded Keywords encompass any terms directly associated with or incorporated into your brand identity.
Visitors arriving at your site via search engines may not always be seeking your brand specifically. This filter empowers you to optimize keywords responsible for attracting cold traffic.
To create this control, we created a parameter following the format outlined below.
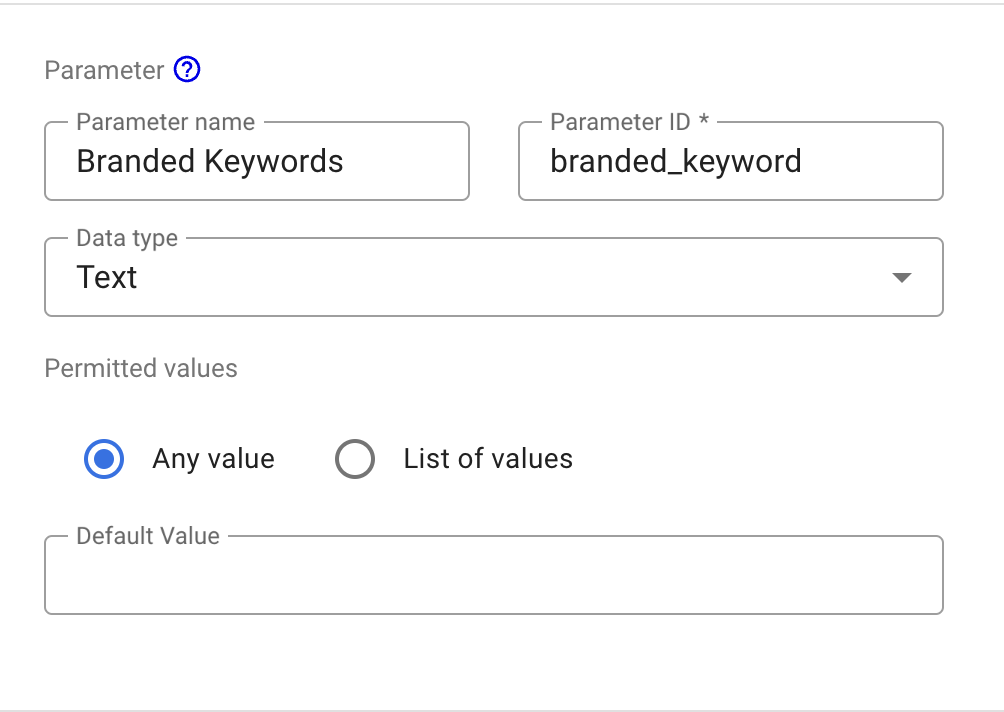
Users can enter words related to their brand, separated by pipes ” | ” in the input box. These words can then be effectively filtered throughout the report.
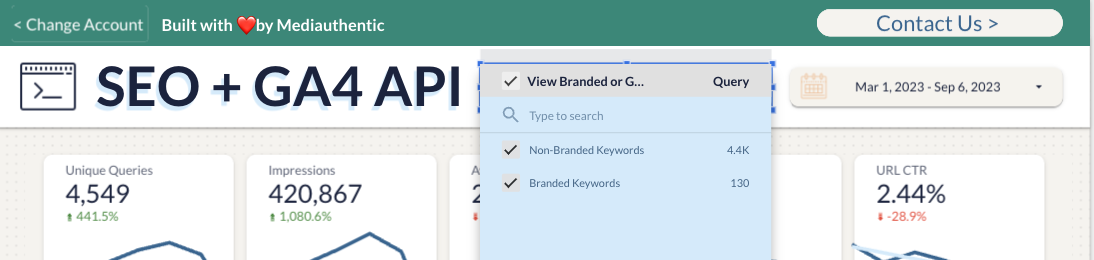
As you progress beyond the Inputs & Accounts section, you’ll encounter a control at the top of subsequent pages, enabling you to choose between Branded or Generic Keywords.
Once your data is connected, and branded keywords are entered, you’re primed to delve into the heart of the report. Let’s jump right into the good stuff!
SEO Trends
Welcome to the first leg of our SEO voyage – where we delve into the essential SEO metrics and their journey through time.
On this Page: SEO Metrics Over Time ????
Buckle up because on this page, we’ll be examining the gradual transformation of your website’s SEO metrics over time.
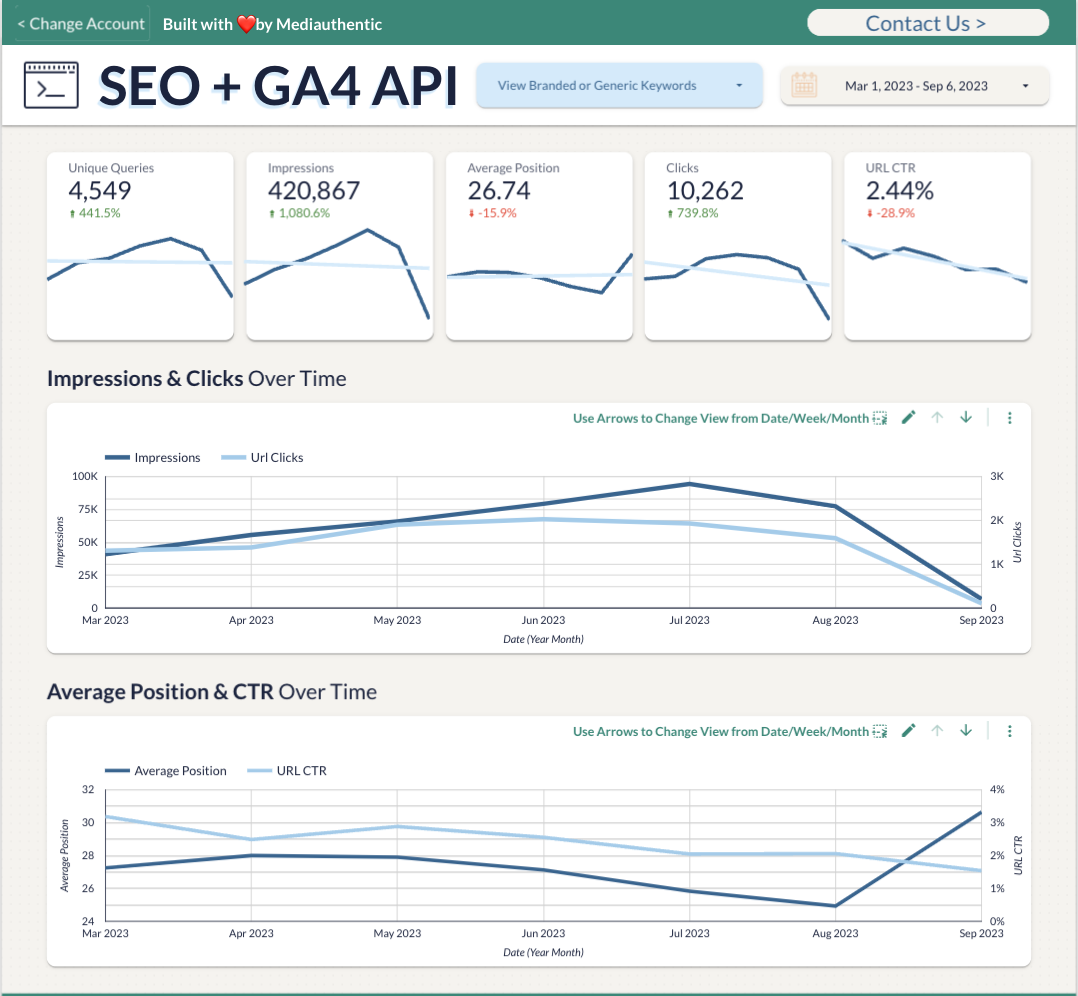
Imagine tracking the progress of key metrics such as Impressions, Clicks, Average Position, and Click-Through Rate as they unfold across the months. With this report, that dream is a reality.
Now, it’s important to understand that SEO isn’t an overnight magic trick. Witnessing tangible results from your SEO efforts, such as sustained improvements in organic traffic, leads, and revenue, typically takes between 6-8 months.
Our Report’s Timeline ????️
Our report keeps things grounded in reality. All the graphs are meticulously designed to present changes on a monthly scale, aligning with the 6-8 month timeline.
However, we’re here to accommodate your preferences. Should you wish to dive deeper and scrutinize your data more closely, look no further than the handy scale-adjustment arrows located at the top right corner of each chart.
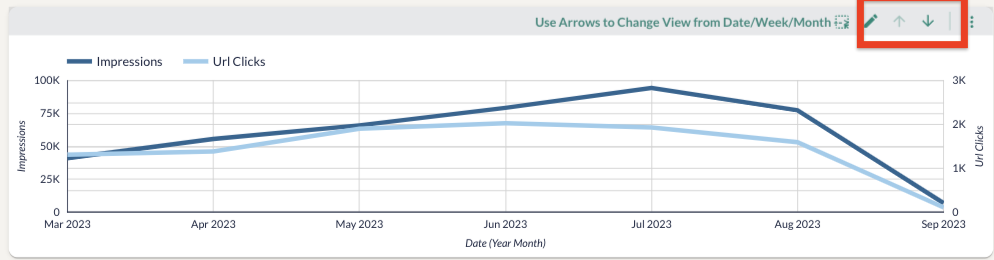
Take your pick between viewing by Date, Week, or stick with our reliable default, the Monthly view.
Keep Scrolling! “Queries & Pages” Await ????
As you continue scrolling down the page, you’ll find the treasure trove of SEO insights – the “Queries & Pages” section.
Here, you’ll discover some powerful filters. These multifunctional tools not only impact the chart below but also influence the time series above.
Utilizing these filters will allow you to track the performance of individual Questions, Queries, and Landing Pages.
Search Breakdown
“Diving Deeper: Query and Landing Page Performance ????
The journey through our SEO report continues as we venture into the next chapter, where we dissect performance on a more granular level by Query and Landing Page.
Digging Deeper with Filters ????️
But wait, there’s more! Our dynamic filters empower you to fine-tune the data to your precise needs and objectives.
Whether you’re tracking specific keywords, assessing the impact of landing pages, or analyzing trends, these filters put you in control.
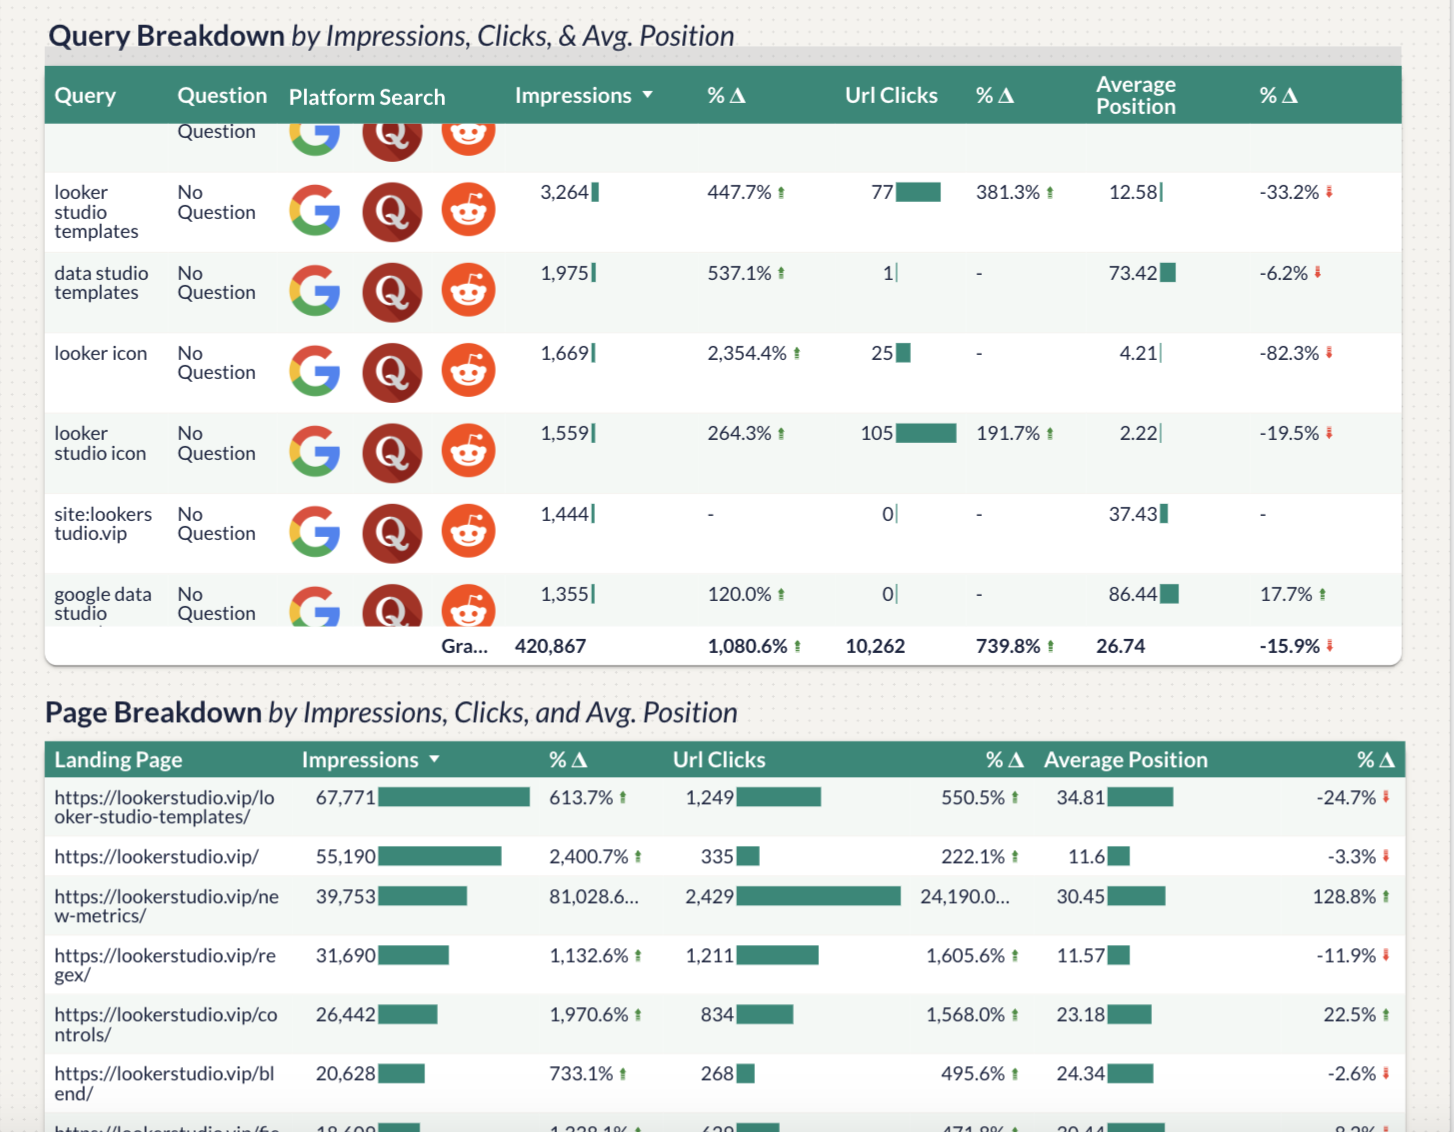
The “Question” filter you will see throughout this report allows you to filter based on common question words and was created using a calculated field.
If you would like to recreate this filter in your own report, use the case statement below!
case

when CONTAINS_TEXT(Query,"how") then "How"

when CONTAINS_TEXT(Query,"what") then "What"

when CONTAINS_TEXT(Query,"when") then "When"

when CONTAINS_TEXT(Query,"who") then "Who"

when CONTAINS_TEXT(Query,"where") then "Where"

when CONTAINS_TEXT(Query,"do") then "Do"

when CONTAINS_TEXT(Query,"are") then "Are"

when CONTAINS_TEXT(Query,"can") then "Can"

when CONTAINS_TEXT(Query,"will") then "Will"

when CONTAINS_TEXT(Query,"whom") then "Whom"

end
Uncover What’s Driving Traffic and Engagement ????
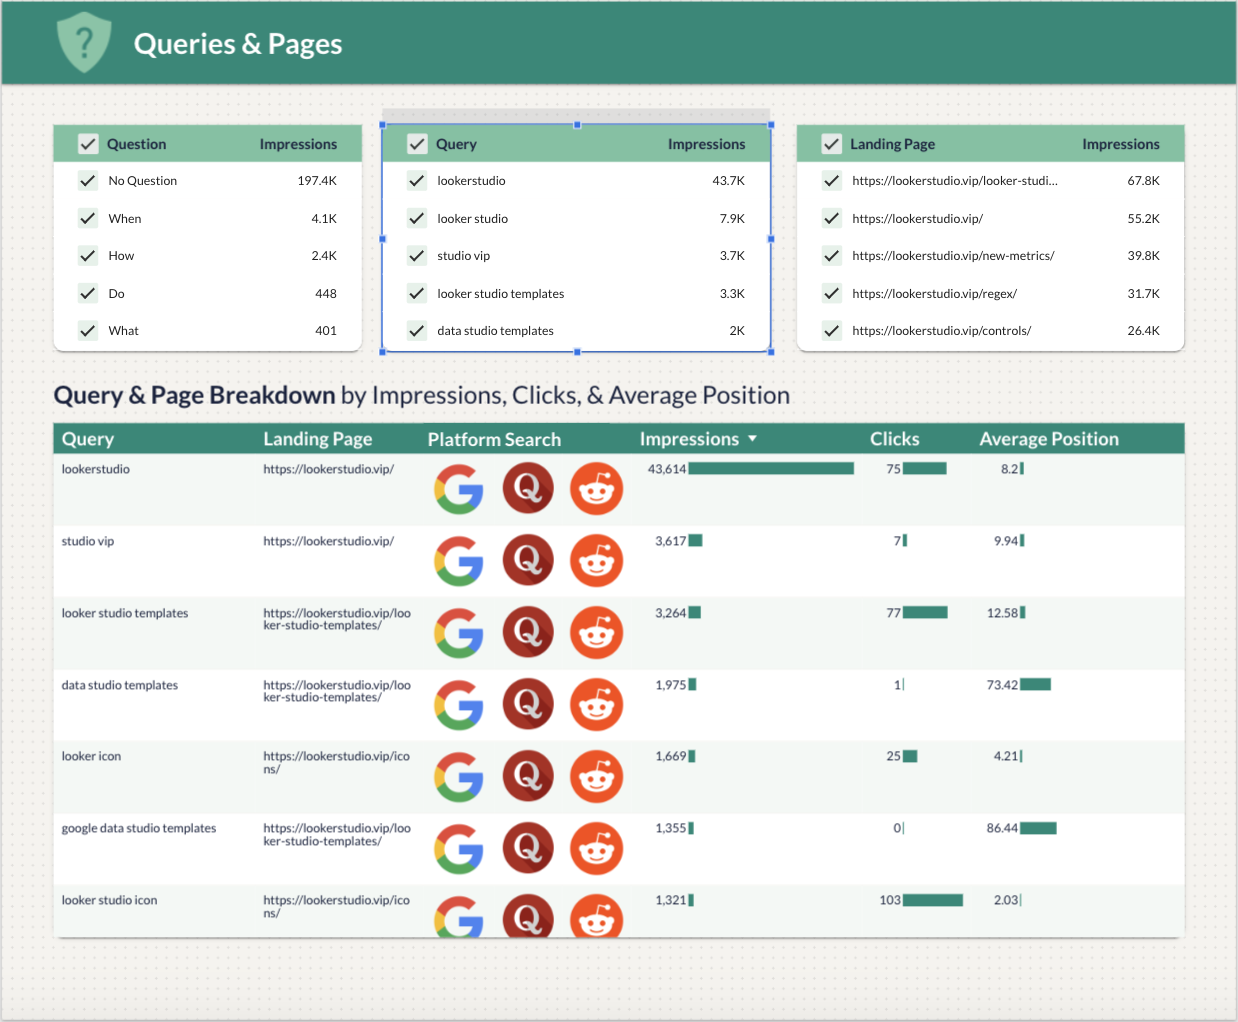
The real gem in this section is the comprehensive breakdown of Queries and Landing Pages.
These interactive charts reveal the nitty-gritty details of individual Query and Landing Page performance, covering key metrics like Impressions, URL Clicks, and Average Position.
Ever wondered which queries are the driving force behind your website’s traffic and engagement? This is the place where you’ll find those answers.
Platform Search ????
The platform search is one of our favorite features in this report as it allows users to quickly view different queries on unique Search Engine platforms like Google, Reddit, and Quora.
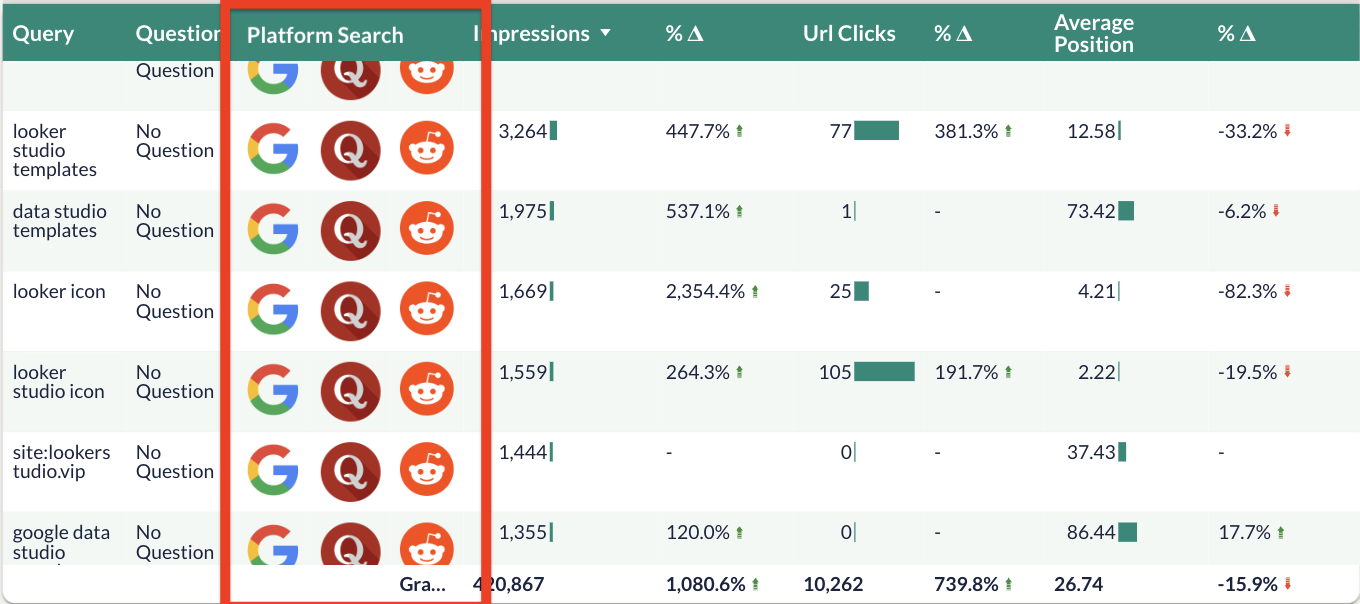
This chart field is interactive, once you find your desired query, click on the icon and it will take you right to the chosen platform with the query already entered in the search bar.
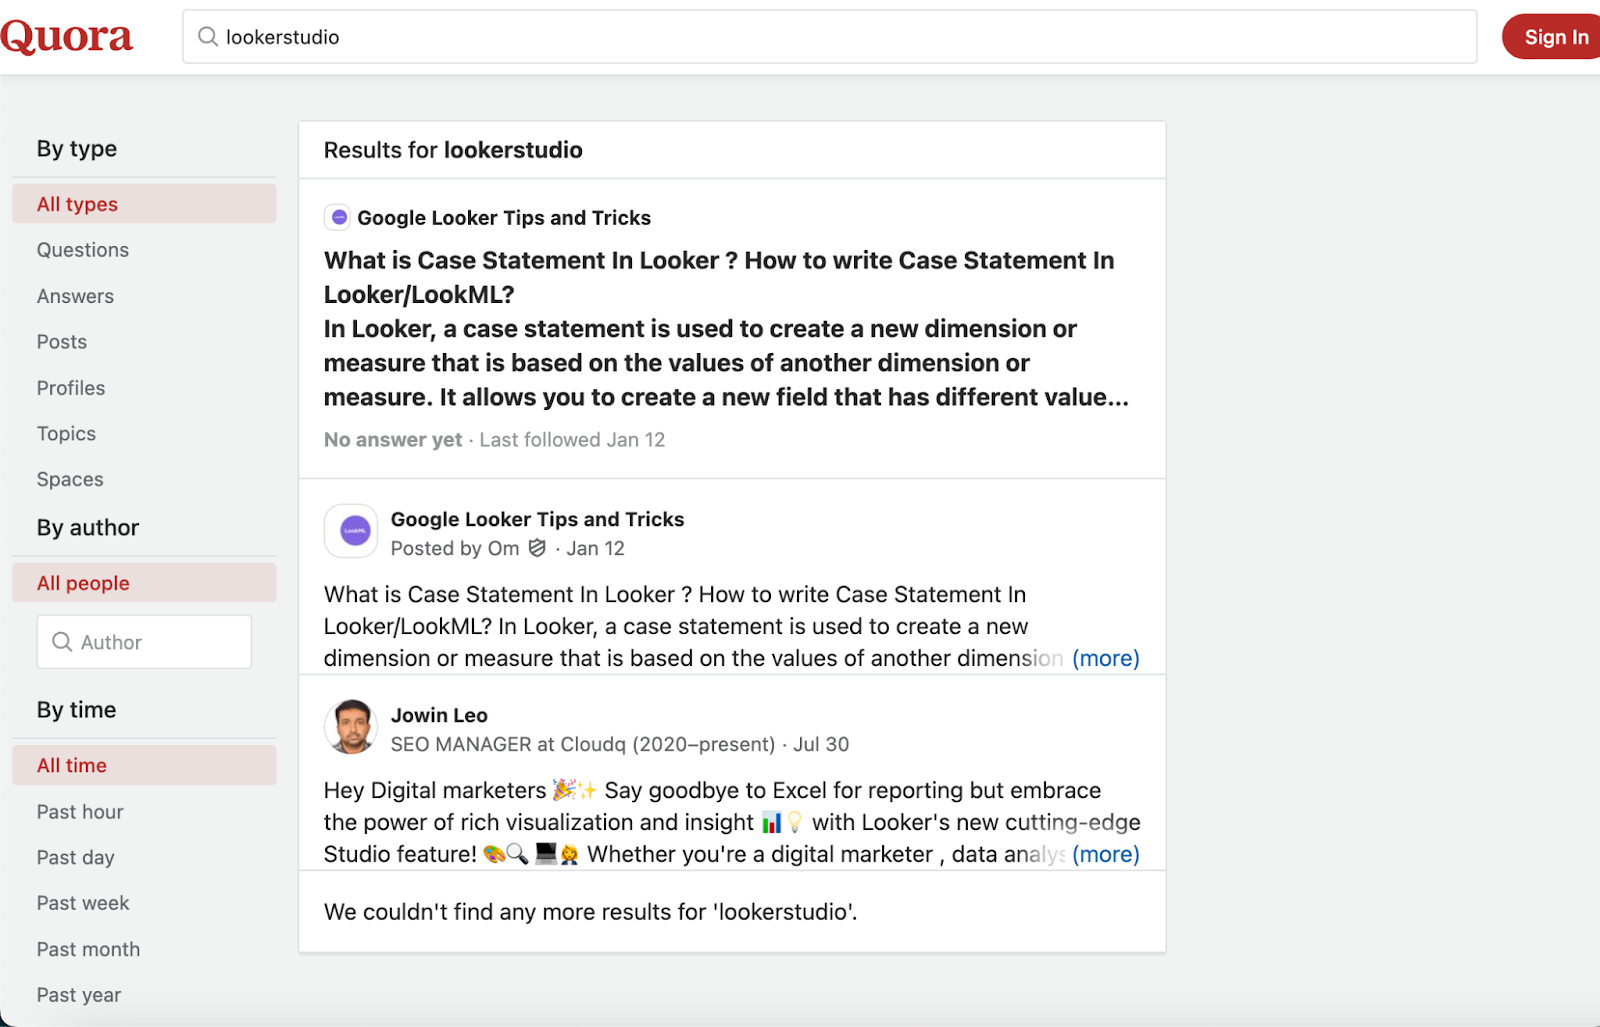
It is an incredibly handy tool to quickly learn what people want to know about specific queries.
Opportunity Trend
Low Hanging Fruit
“Harvesting Low-Hanging Fruit: Your SEO Secret Weapon ????
Between you and me, this page might just be the MVP of our SEO report, packed with actionable insights you won’t want to miss.
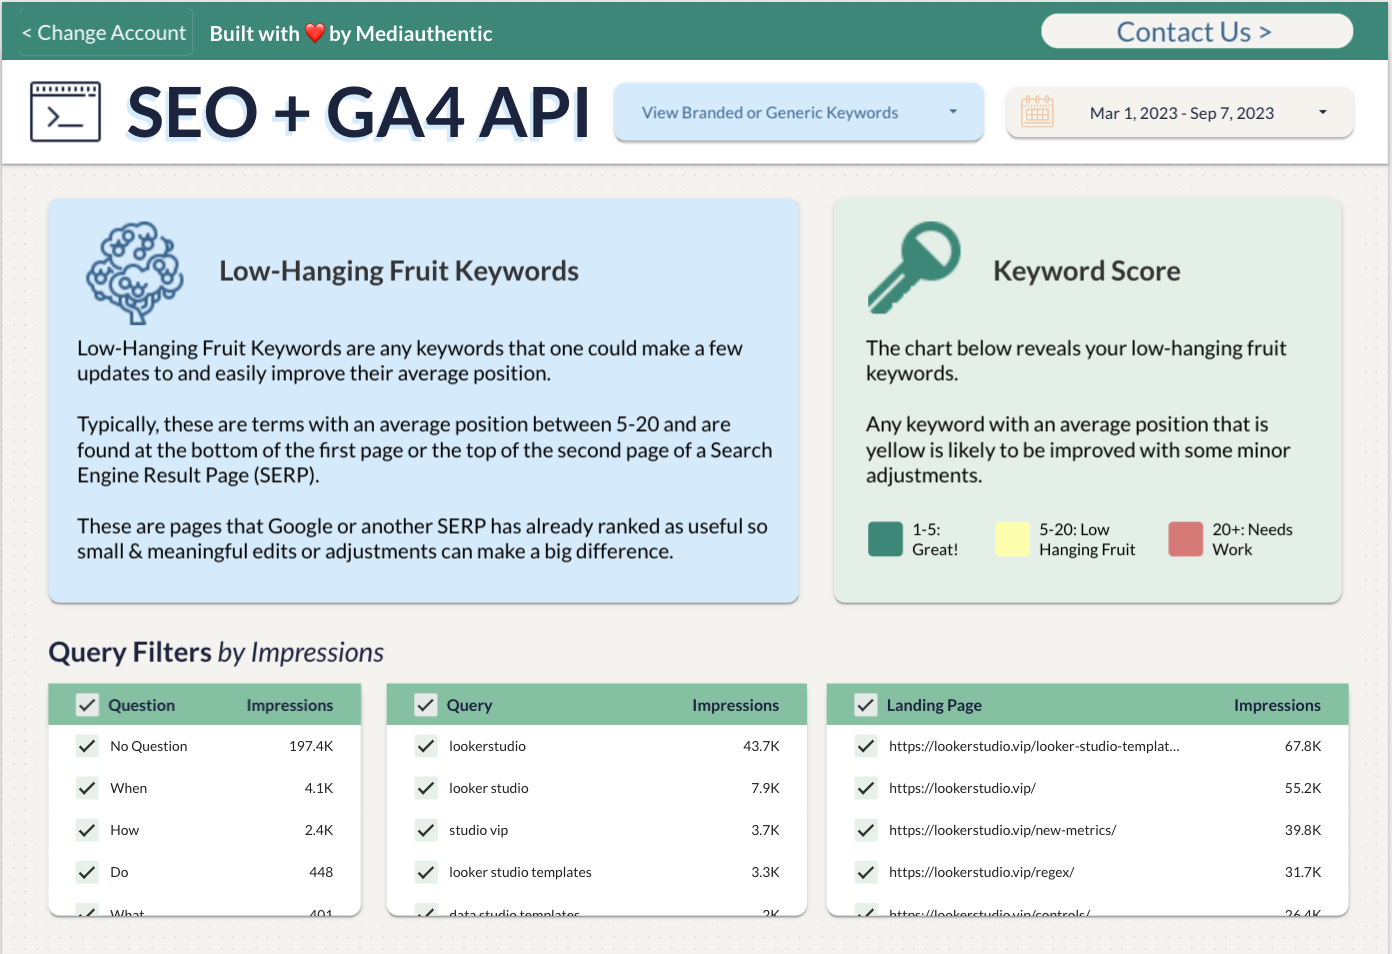
Enter Low-Hanging Fruit ????
Let’s face it, SEO can sometimes feel like deciphering an impossible code, especially if you’re still honing your skills. But don’t fret; we’re here to lend a helping hand.
Meet your SEO savior: Low-Hanging Fruit Keywords.
These are the keywords that, with just a few tweaks, can send your average position soaring. All they need is a bit of a touch-up, and they’ll yield significant results.
These gems usually hang out in the sweet spot between positions 5 to 20, nestled at the bottom of page one or the top of page two on Search Engine Result Pages (SERPs).
Charting Your Path to Success ????
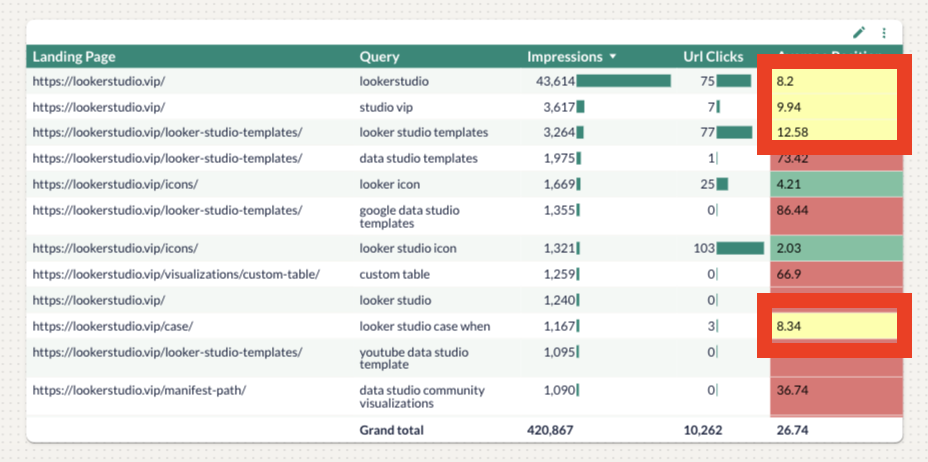
On this page, we’ve got a nifty chart breaking down your landing pages. But here’s where the magic happens: Average Position. Through some nifty conditional formatting, we’ve made it crystal clear where your Low-Hanging Fruit is hiding.
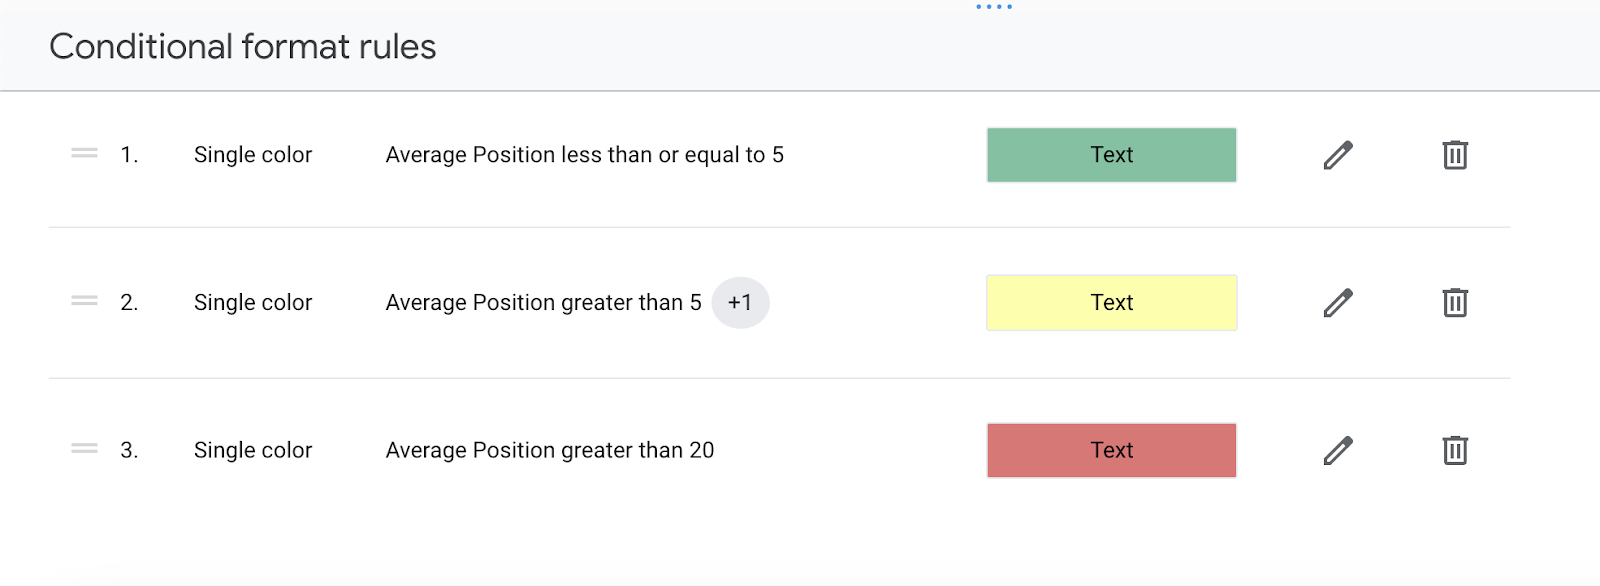
Our Scale is as follows:
Green: Average Position of 1-5 (Top 5, Woohoo!!)
Yellow: Average Position of 6-20 (These are your juicy SEO fruits)
Red: Average Position above 20 (These will need more work to see improvement, it’s harder, but absolutely possible)
The Yellow Brick Road to SEO Success ????
Any Average Position you see turning yellow in the chart is your golden ticket. These are the keywords that, with a little TLC, can easily level up your SEO game.
GA4 Landing Page Report
Benefits of an SEO + GA4 API Report in Looker Studio ✅
Creating an SEO + GA4 API report in Looker Studio offers several advantages:
- Single Source of Truth: Consolidating your data sources into one report eliminates the need to switch between multiple platforms, saving you time and reducing the risk of errors.
- Customization: Tailor your reports to your specific business goals and KPIs. Whether you need high-level overviews or in-depth analyses, Looker Studio can accommodate your needs.
- Collaboration: Share your reports and dashboards with team members, enabling collaboration and data-driven decision-making across your organization.
- Ease in to Complicated Concepts: SEO is notoriously difficult, this report allows you to pinpoint areas of easy improvement and serve as a strong foundation in your SEO journey.
Conclusion: Empowering Data-Driven Success ????????
In today’s competitive digital landscape, data is your most valuable asset. Leveraging the combined power of SEO and GA4 data through Looker Studio can transform the way you understand and improve your online presence.
By creating custom SEO + GA4 API reports, you gain a comprehensive view of your website’s performance, enabling you to make data-driven decisions that drive success.
Are you ready to unlock the full potential of your data? ????
Get started with our SEO + GA4 Connected report today and embark on a journey toward data-driven excellence. Your business’s success is just a click away.


