
Brand performance · Media efficiency
Brand Marketing Performance
The whole media chain in one view, from impression to signed revenue, with cost and efficiency at every step. Filter by channel or campaign type, switch the period between day, week and month, and see what paid actually contributed against everything that was not paid.
- Live and interactive
- Queryable via MCP
- Sample data
 See it live ↓
THE QUESTION THIS ANSWERS
What did our media spend actually buy, once you follow it all the way to revenue?
Why this dashboard exists
Ad platforms report the part of the journey they can see, and they each report it as if they closed the deal. Add up the platform-reported conversions across four channels and you will find you sold more than you did. Meanwhile the finance number is real and nobody can tie it back to a campaign.
This dashboard is the join. One chain, one set of definitions: spend and impressions from the platforms, leads and consults from the CRM, and won revenue from signed contracts. Every efficiency metric on the page is derived from that same chain rather than pulled from a platform dashboard.
The band that matters most is the one that ignores the filters on purpose. Paid versus the rest of marketing only means something with everything in view, so that section deliberately refuses to respect the channel filter above it.
How to read it
Four things the numbers above are saying. Every figure is on the dashboard, so check our work.
Paid buys most of the leads and a minority of the revenue
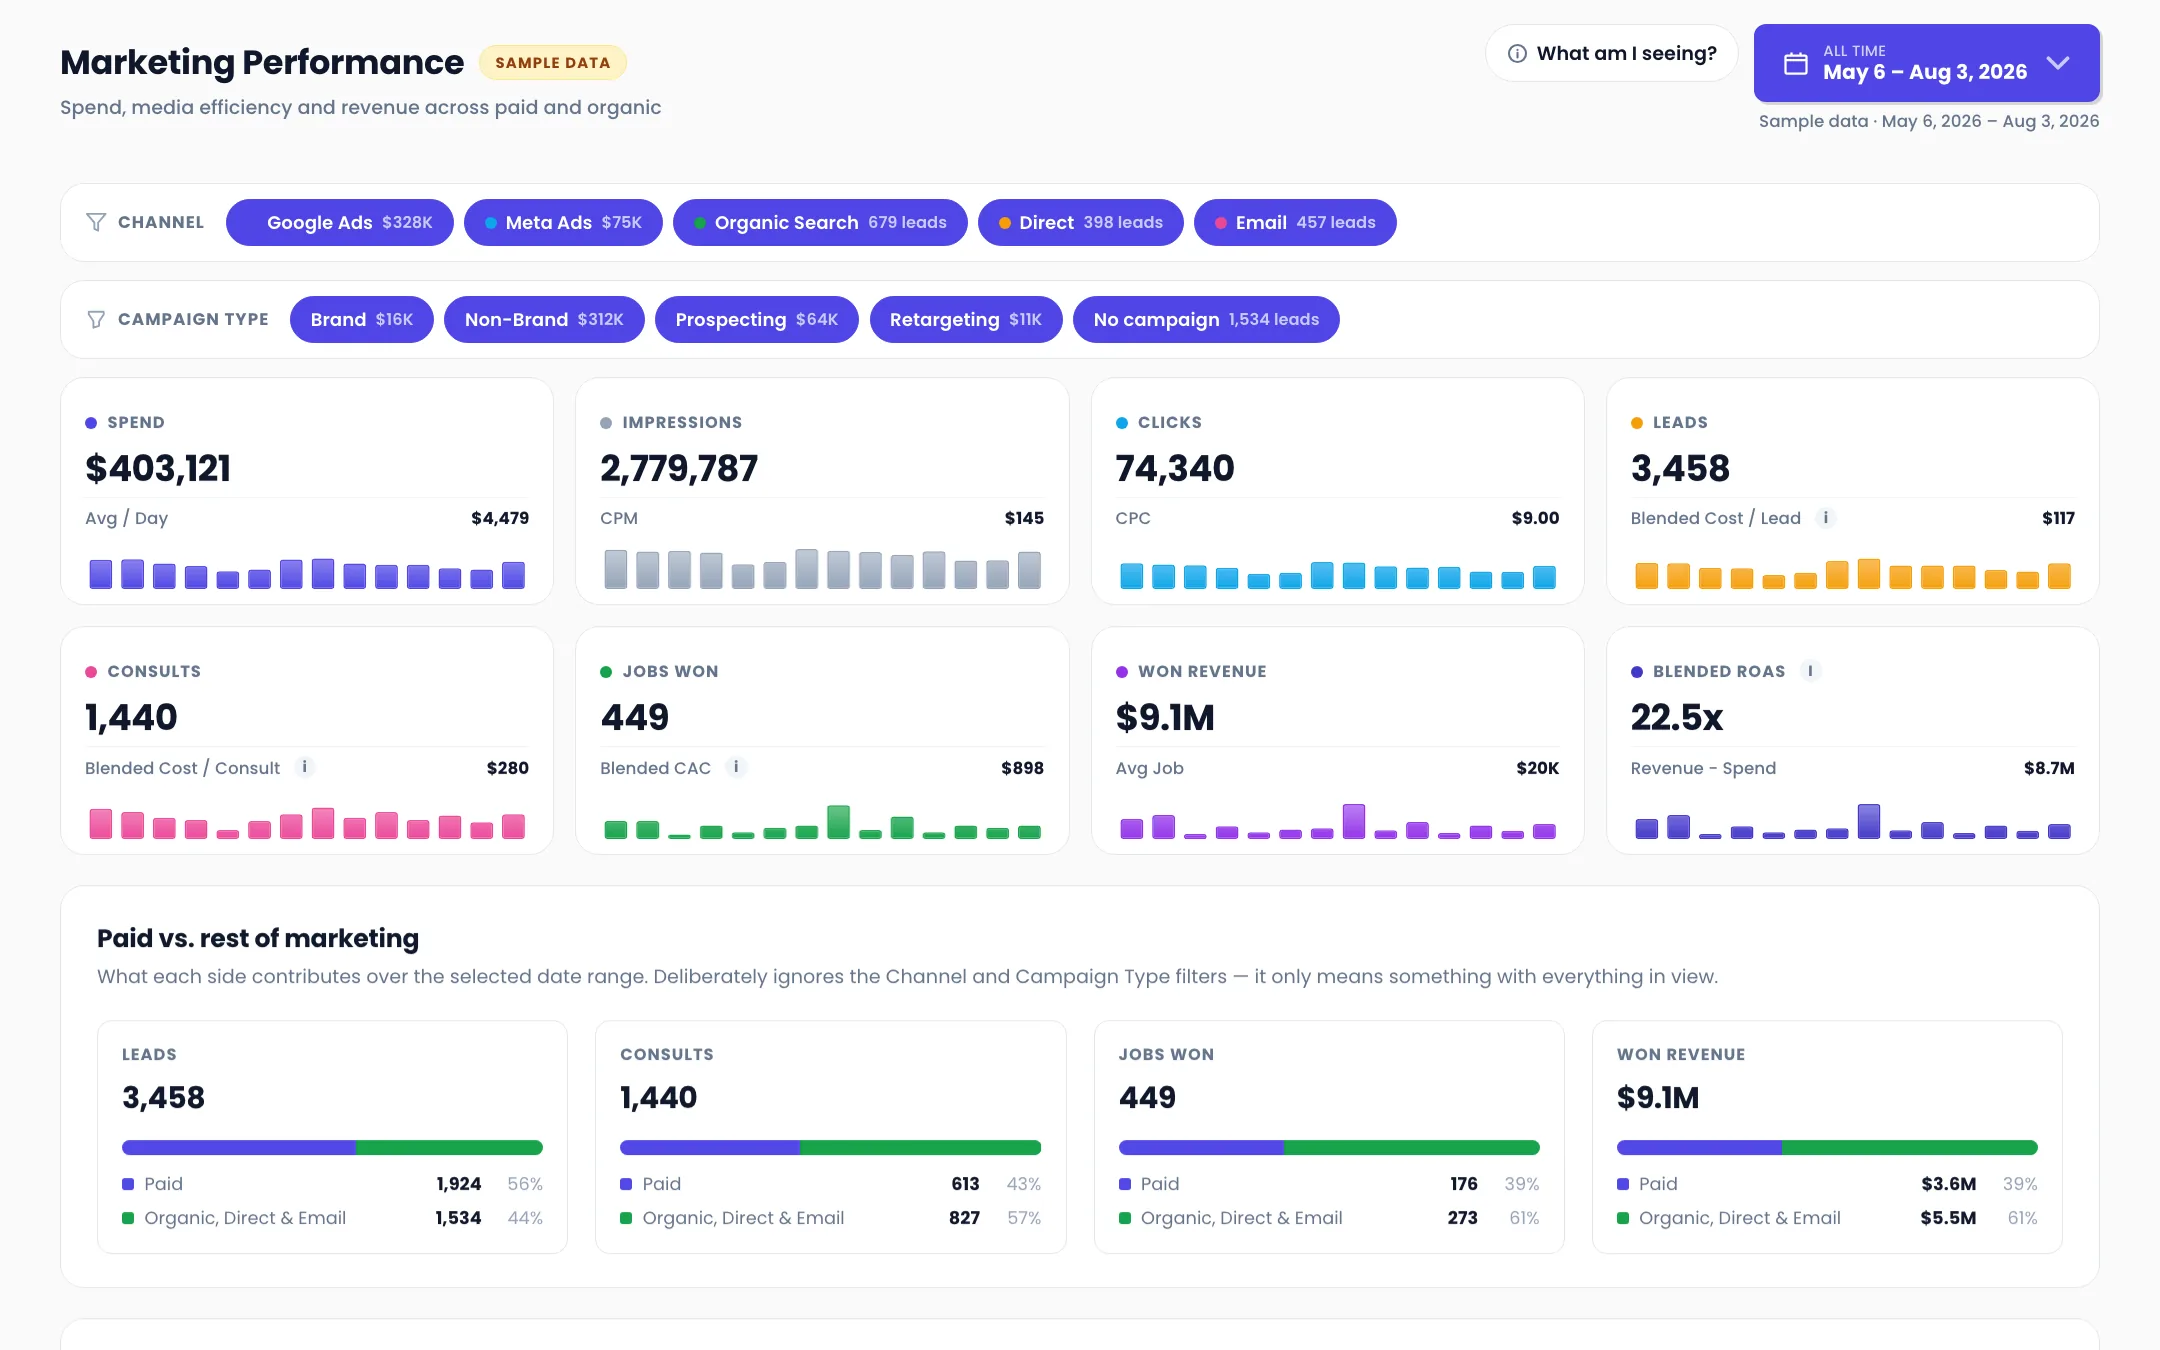
Paid produced 1,924 leads, 56 percent of the total. It produced $3.6M of won revenue, 39 percent. Organic, direct and email produced fewer leads and $5.5M. The gap widens at every step down the chain: 56 percent of leads, 43 percent of consults, 39 percent of jobs. A media report that stops at lead volume tells you paid is the majority of the business. It is not.
Blended ROAS of 22.5x is real and almost useless on its own
$9.1M of won revenue against $403,121 of spend. That number is true, and it is flattered by $5.5M of revenue that spend had nothing to do with. Paid-only ROAS is closer to 9x. The dashboard shows the blended figure because it is what the business experiences, and shows the paid split right next to it so nobody quotes the first number without the second.
Non-brand carries the budget, brand carries the rate
Non-brand took $312K of the $403K, prospecting $64K, brand $16K and retargeting $11K. Brand spend is four percent of the budget on a channel that converts far above the average, which is the usual shape and the usual argument: brand looks efficient because it is capturing demand something else created. The campaign-type filter is there so you can test that rather than assert it.
The cost per lead barely moved while CAC swung 60 percent
CPL sat between $112 and $127 across fourteen weeks. Blended CAC over the same period ran from $756 to $1,186. Everything interesting happened after the lead, in the consult and close rates, which is exactly where the ad platforms stop reporting and where most optimisation effort is not spent.
What it settles
- What did we pay per customer, not per lead?
- How much of our revenue would exist without any paid spend?
- Which campaign type is actually carrying the budget?
- Did efficiency change, or did we just spend more?
- Where in the chain did last month's decline happen?
- What does blended ROAS mean here, and who decided that?
What every number means
The definition of every step this dashboard counts, in the same words the dashboard uses.
- Spend
- Media cost from the ad platforms for the selected period, in the account currency. Excludes agency fees and production.
- Impressions
- Paid impressions as reported by the platform. CPM is spend divided by thousands of these.
- Clicks
- Paid clicks as reported by the platform. CPC is spend divided by these.
- Leads
- People who submitted a quote request in the CRM. Counted on submission date, not on ad-click date, and deduplicated per person.
- Consults
- Leads who booked an in-home consultation with a salesperson.
- Jobs Won
- Consults that became a signed contract. Won revenue is attached to this step.
- Blended CAC
- Total spend divided by total jobs won, including jobs that came from channels with no media cost. Blended on purpose: it is what the business actually paid per customer.
- Blended ROAS
- Won revenue divided by total spend. Revenue is the signed contract value, not pipeline.
Attribution basis. Leads, consults and jobs are credited to the channel, campaign and landing page of the person's first tracked visit, and they stay there for the rest of the chain. Blended CAC and blended ROAS deliberately divide by total spend including the channels that cost nothing, which understates paid efficiency and overstates the whole. Both numbers are useful and neither is the same question. Which one you quote should be a decision, not an accident.
In a deployment these definitions do not live in a footnote on a marketing page. They live in your Metric Glossary, and every query has to consult them before it touches the data. That gate is how you govern reporting, and it is why two people asking the same question on a Thursday get the same number.
THE PART A SCREENSHOT CANNOT DO
Every number here is a table. Ask it anything.
The dashboard above is one view of the data underneath it. Somebody chose those steps, that date range, and those four filters. It is a good view, and it will still be the wrong view the first time someone asks a question nobody anticipated.
So the same tables are exposed through your organization's MCP. Claude, Cursor, or any AI client your team already uses connects with a scoped key and asks in plain English. Every question consults your metric definitions first, which is why the answer matches the dashboard instead of arguing with it.
- What is our paid-only ROAS, excluding organic and direct revenue?
- Which week had the worst CAC and what drove it?
- Compare brand and non-brand on cost per signed job.
- How much revenue came from channels we did not pay for?
- What does blended CAC include in this report?
- Post the weekly media summary to Slack every Monday at 8am.
One endpoint for the whole company. Anyone gets an answer from the warehouse without writing SQL or re-explaining what revenue means. Same Claude. It just stops guessing.
Programmatic access is the most governed path in the system, not the loosest. Per-application keys, single-tenant scope, rate limits, instant revocation, and the acting identity recorded on every request. Read how AI access is governed →
Where the numbers come from
In a deployment, the rows behind a dashboard like this arrive from every platform the business runs on. Ads, analytics, the CRM, and the contract values that close the loop. They get synced, modeled on the way in, and stored in a warehouse wired to your billing account.
- Google Ads
- Meta Ads
- Organic search
- Direct
- Your CRM
- Signed contract values
Your tools stay exactly where they are and become sources instead of homes. Swap an ad platform next quarter and the reporting holds. See the full pipeline → or decide who runs which piece →
Questions about this dashboard
Is this real client data?
No. The rows are synthetic, generated for this demo. The metric chain, the written definitions, and the pipeline that would feed them are the real thing.
Why does blended ROAS include revenue that paid did not generate?
Because that is what blended means, and because the business experiences the blended number. It is the honest answer to how much revenue came in against how much we spent. It is the wrong answer to whether the next dollar of spend is worth it, which is why the paid split sits directly beside it.
How is this different from the conversion funnel dashboard?
Same business, same underlying tables, different question. The funnel asks where people are lost between steps. This one asks what the media bought. Both read 3,458 leads and 449 signed jobs because they are the same governed numbers, which is the point.
Why is a part-week marked partial?
Because the selected range starts and ends mid-week, and a part-week of spend rendered next to full weeks reads as a collapse. They are kept rather than hidden, and labelled so nobody trends off them.
Can I see this on my own spend?
That is the product. Your ad accounts, your CRM and your revenue sync into a warehouse you own, every metric gets defined once in a glossary, and reports like this sit on top. The first live dashboard usually lands inside 2 to 4 weeks.
How would my team query this instead of reading it?
Through your organization's MCP. Claude, Cursor, or any AI client connects with a scoped, revocable key, and every question consults your metric definitions before it touches the data. Nobody has to remember whether CAC was blended or paid-only, because the definition answers first.
Keep looking around
The Data OS
The full tour — what it is, what you get, and how engagements work.
Take a look →Why we built it
Most teams don't have a data problem — they have a trust problem.
Take a look →Ask it anything
Four questions, five people who can't answer them, and one system that can. Play the demo.
Take a look →Who runs what
Fully managed by Vision Labs, or run by your team. Drag the blocks and set the split.
Take a look →Security & Trust
Encryption, tenant isolation, least privilege, audit — the posture IT will ask about.
Take a look →For your boss (and IT)
The forwardable one-pager that gets you sign-off, with a copy-paste email.
Take a look →Ready when you are.
Want this shape on your own numbers? Thirty minutes with JJ. Bring the funnel you cannot currently see end to end, and we will map what it takes.