Built a highly actionable data plan that works for you to move faster than ever before. Use this framework in conjunction with your data frameworks to iterate faster than your competition.
We are going to be talking about building your data action plan. What is the data action plan?
We will start to dive into that because most people don’t have a way to act on their actual data. It’s remarkable how many companies we see that come to us and want data for data’s sake, and it becomes a behemoth to manage over time.
What is Vision Labs?
We are a Measurement Department and data team we work with clients ranging from 5 million to $250 million per year that range from Ecom, B2B, B2C, SaaS, Direct Response, Content you name it we’ve probably done it and are currently doing it with our client base.
Mostly we operate in the Google stack so that’s Big Query, Looker, Looker Studio, GA4, Tag Manager, Etc.
Who we are?
We have JJ Reynolds founder of Vision Labs and Stockton who is the director of client strategy.
Ask yourself: “How do I know what action to take?”
Ask yourself: How do you know what action to take? It takes a lot of self-reflection to know how you know what you’re trying to accomplish.
Oftentimes what happens is you have some sort of data, we have a person and then we just do this. And this thing that you’re doing could be different, it could be unactionable and so it comes down to like this Voodoo stuff.

People are reading these data cards and what we’re going to do is we’re going to basically put everything together and I’m going to say: “Hey, go do this thing.” and it might be different every time. It’s not the same methodology, it’s not the same way of doing things, it’s different every time and it causes problems.
So we want to try and avoid this as best we can.
Data + Structure + Action
What we’re trying to accomplish is: we have data, we have it in a structured way, we can present it in a structured way that leads people to take action. If we can do that reliably and consistently the value starts going up and up and up.
Big Problem: Turn a Number Into an Action

The big problem is to turn that number into an action if I show you this report, you’re like cool I’m going to go back to doing what I was doing let’s stop talking about this.
Data Action Playbook
What we’ve done is we’ve created a data action plan and this is what that looks like:

This is how we’re starting to think about things when it comes to building out road maps for better data, more useful data and more actionable data. I’m going to give you a high-level overview of how to look at this so that you have an idea.
At the very bottom we have our acquisition strategy, how are we acquiring customers how are we acquiring revenue?
We move up, and then we have our conversion tactics, which are going to be website conversions, behavioural tracking and then all that good stuff.
And then we have retention and profitability at the top.
And so what we’re going to do here is starting at the bottom left we’re going to work our way up. And at the end of this for every initiative that you do, you should be able to have a plan.
The goal is that you have a plan to execute so you know if your plan is working versus not working.
Acquisition Strategy

What you want to do looking at the first orange block is you want to set a goal for what you’re trying to accomplish.
Let’s take an initiative that anybody could use, let’s just take a new year initiative that you’re running. Let’s say you’re trying to get sales for supplements, or you’re a gym trying to get new people.
Right now one of our clients is running a back-to-school initiative because a lot of schools start the first week of August so right now is the back-to-school time.
So what is the goal for that time?
Are we trying to acquire new customers, are we trying to break even on those new customers and build their lifetime value up over time, are we trying to make a certain marginal profit on these customers, or are we trying to make a larger value for those customers?
Write down what is the overarching goal of this initiative. Then you can break that down into individual platforms. For example: for Facebook, we would like a 2X ROA, we would like to have a new customer acquisition cost of around a $50 CPA, and our email should have this outcome…
Every single platform you’re now breaking that down and you’re taking your goal into that. And then you have a target initiative or target efficiency for that goal.
For example the back-to-school example, we’re going to spend $50,000 and our target is we’re going to have an acquisition marketing efficiency ratio of 1 meaning we’re going to spend $50,000 and our goal is that we have $50,000 of new customer Revenue. That is their target.
What we’ve been able to do is say: our goal for this plan is to break even, the reason why we’re going to break even is because we’re selling a subscription on the back end and our target is to raise the lifetime value within 365 days by 50%.
Now have a plan to go and execute against.
How does that work? Just write it down!
I kid you, not this is what we started with. Write down the initiative name and then say what is the goal of this initiative.
I guarantee you this will blow some people’s minds if you say we are doing a 4th of July sale, we are doing a new customer onboarding flow, this is the initiative this is what the goal of that initiative is.
It will blow your mind at how simple that is and then it makes everyone’s impact so much uh greater.
Everyone always comes back with “I don’t know, what should my target be?”, just start, just write it down brands that are doing hundreds of millions and 1 million have done this and it makes it so much easier.
You will be wrong… but get better each time
You’re going to be wrong but you’ll get better every single time. The overall plan here is that you have a plan, and you have an outcome and where those overlap you have the ability to act.

So the plan is that we’re going to do $50,000 in ad spend to acquire $50,000 worth of new customers.
After the initiative is done, we can say did we acquire that? Did we break it down by the channels, so how did Facebook do? How much did we spend? How much did email do as far as new customer growth?
And now we can write down our outcome. And we write it down in the same type of form where we say hey our outcome was that we actually did $10,000 in new customer Revenue so we had a .2 (a)MER return and it was not nearly as good as we thought.
So now we have two options we can look forward and say, next initiative we need to lower our expectations or we need to come back to the drawing board and see do we need to send more emails, run more ads, change what we’re doing or is the expectation just that unrealistic.
You now have something to execute against.
In that acquisition strategy row at the bottom, we now have the Goal of Marketing and Advertising, we set a goal we’re going to spend $50,000, we’re going to acquire $50,000 of new customer revenue, we’re going to do that with 60% of that on Facebook and 40% of that on our email list of non-existing customers.
That’s the plan, our target efficiency ratio is going to be a 1 (a)MER and we could even have a (a)MER of a different number, so now we have a target efficiency.
Let’s now go one level up, that planning section, everyone thinks it’s the easiest, but I promise you it’s the hardest.
Conversion

Now we have the stuff that everybody thinks is very difficult, but it will become easier over time.
We need to have website conversion tracking so we need to have the best data being sent to every platform as well as our data warehouses at the best possible interval. Meaning do we need it hourly, daily, weekly, etc. the data needs to get to each platform.
Behavioural tracking is for when things do not go right, this is talking about your Microsoft clarities, your hot jars, your heat maps, all of those types of things.
We then have uh your “by” questions, your traffic, landing page sources, etc.
This is where you take your behavioural tracking, you take your conversion tracking and you ask “by” questions, these are something that we talk a lot about inside of Vision Labs inside of the lab is what “by” questions are the most useful.
You can take your revenue number, or you can take your traffic number and you can break it down by your traffic Source, or you can break it down by your device category, and that’s where you start to have reports realized.
You have your plan, you have your execution, and you have your reports that need to match the plan. That is what we are doing and the more you can do that consistently the better it will be.
This is where people start getting into tools, there are All-In-One tools that do this for you. The intentionality is what matters the most, why are you using this all-in-one tool and what do you need?
We prefer the Google stack, we use GA4, server tracking, and Microsoft Clarity, and the overarching theme is that we have really solid reporting. Now your reporting matches your plan.
Now we have our conversions, we have our Behavior Tracking we have our landing pages we have our sources we have our breakdowns, we have everything that we need that should marry up with our plan.
The people that we talk to a lot like to start here, they like to start with the websites, they like to start with the behavioural tracking, start with the landing page and the traffic etc it’s easy, it’s tangible but if you don’t have a plan it becomes useless very quickly and it becomes a lot less useful as a whole.
Plans are married to metrics
Your plan must be married to your metric. I promise you that if you marry your plan to your metrics you will become a much happier camper.
Retentions Forecasting

The last rung on this ladder is retention and we’ve grouped a bunch of things into this retention and the idea is that you can take that cohort and track it over time.
In our back-to-school sale, we broke even, (a)MER of 1 we spent $50,000 we gained $50,000 well the goal is that we can then increase that customer lifetime value over time.
Over time we’re able to say we broke even we had $50,000 in this cohort at the end of July and now when we look at that over time the goal is that we’re increasing that cohort by 50% over one year.
So we have to have a way of tracking that cohort by volume of dollars and volume of customers. If you don’t have a way of doing that it becomes very hard to know if your plan is actually working.
One e-commerce client that we did this with, their plan to lose money on the first order with this sweet entry-level offer so their (a)MER is going to be low because their acquisition marketing metric is going to say we’re acquiring customers at $50 a cost per acquisition but they’re only worth $15 to us because that’s the trial value.
We’re losing $35 on the initial sale but their customer acquisition cost is very low as well so now they’re acquiring a lot of customers but are they actually becoming profitable?
Well, now we have to know what are the costs, the cost of goods, the cost of advertising, the cost of capping everything else and then what the outcome of that overtime.
Over the expected payback period are we realizing that? I believe that they were shooting for 30% in the first 30 days and 100% in the first 90 days so every $15 was going to be worth 30% more and then there was be worth $30 more in the first uh 90 days. And I believe that was realized.
The problem was is that their customer acquisition cost was about equal to their 90-day value, so they’re breaking even over 90 days, not the best model you kind of have to realize revenue much quicker.
But they knew that because of the reporting that we were able to work with them on, we had a plan we had an execution we had the cohort the cost and the profit all together at once.
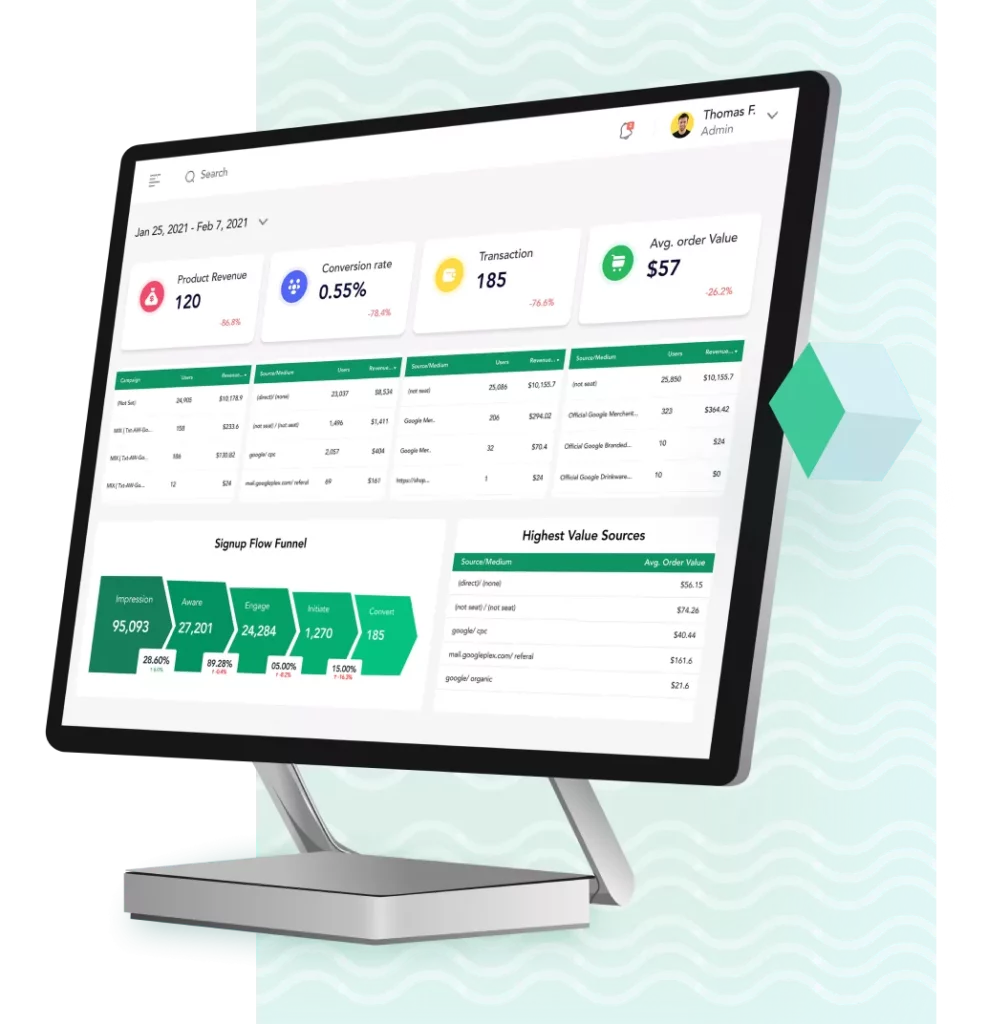
If you can do that, you can build something like this:

This is an example where you have a plan and you can say: we’re looking at our one-time orders, we’re looking at the revenue from the first day, 7 days, 14 days, Etc
Now you’re able to take your plan and marry that with your reports because you have all the data in the pipeline.
Getting costs into your system
Getting costs in your system can be one of the most complicated things, your different costs of goods in business vary wildly so for example: in some low-cost good businesses where you have info book products and software, your cost of goods is very low.
In e-commerce, we worked with a meat packing company and we worked with a live coral company, their cost for shipping was so high, $60 – $100 that’s a very different business model.
Someone’s not buying it on subscription usually, they’re usually being very intentional about what they’re looking for and so you need to be aware of that and as you start planning.
For your next initiative you can have all this in mind.
At the end of the day, you can say this initiative of our back-to-school plan we can then say was or was not working, did not have the profit, it did not have the costs, it did not have uh the lifetime value that we expected to be realized and now we could go back for our next initiative and have that in place.
What’ we’ve done is basically for every single initiative we need to have:
- Acquisition Strategy:
- Goal of the marketing/Advertising
- Individual Platform + Funnel Strategy
- Target Efficiencies
- Conversion:
- Website Conversion Tracking
- Behavioural tracking
- Traffic, Landing Page, Source
- Retention:
- Cohort (volume of $$)
- Costs
- Profit
Main Take Away: Write down your plan
The main takeaway is write down your plan! I know that sounds wild buy your plan needs to be realized.
Whether your plan works, or doesn’t work both outcomes are equally useful. You executed your plan and your outcome and you realize them together.
Over the next few weeks and months we’re going to start doing more and more content around this because if you plug a great system into collecting your data building out your data management and everything else you need to have a solid plan that enables you to act again and again.
Final Notes
We are going to be covering this more in our lab coaching program as we start to realize the actual plan better. We have an MVP that we’re working on internally.
The final Mantra of what we want to help companies do is to suck less! This is the plan that will help you do that.
You don’t need novel marketing ideas, and you don’t have to do the next viral marketing campaign, just take where you’re at come up with a strategic plan to execute against very specific things that will just help you suck less and therefore do better.
That’s one thing I think that people underestimate, if you just stopped doing 30% of what you’re doing, you’d be 30% better. And that’s an underestimated hack of Life of how you increase profit margin.
If you’re a business trying to get sales why are you spending time tweaking the CSS of a button on your website?
If you’re in D2C and you’re trying to get sales certain things just don’t matter and so the DAP the Data Action Plan lays out the expectation of what you want to do and then you go and execute against that and cut out all the noise that’s not going to get you to that plan.
That’s it! We’re miring this really complex data structure of us being able to extract data, store it, visualize it very quickly and then also have the idea of you now have a plan and you have reporting that is married to that plan and so your reports should make a lot more sense to you.
If you’d like to have this done for you and managed for you just fill out one of the contact forms on the website VisionLabs.com.
And if you are a contractor, consultant, agency Etc join The Lab we’ll be talking more about this every single week as we start to roll out this framework to be a more useful outcome in life.