Edit Mode Interactions, Using Pages efficiently, and Image Links

Edit Mode Interactions, Using Pages efficiently, and Image Links
Last Updated: March 27, 2024
We now have Edit Mode interactions, page groups, Icons, & images have dynamic links for us to link to other pages from GDS.

Use Data As Your Competitive Advantage

Learn exactly how VisionLabs can fix your data setup, improve tracking, and build a measurement plan based on your goals.

Table of Contents

DataStudio Updates on December 1, 2021!

Edit Mode Interactions

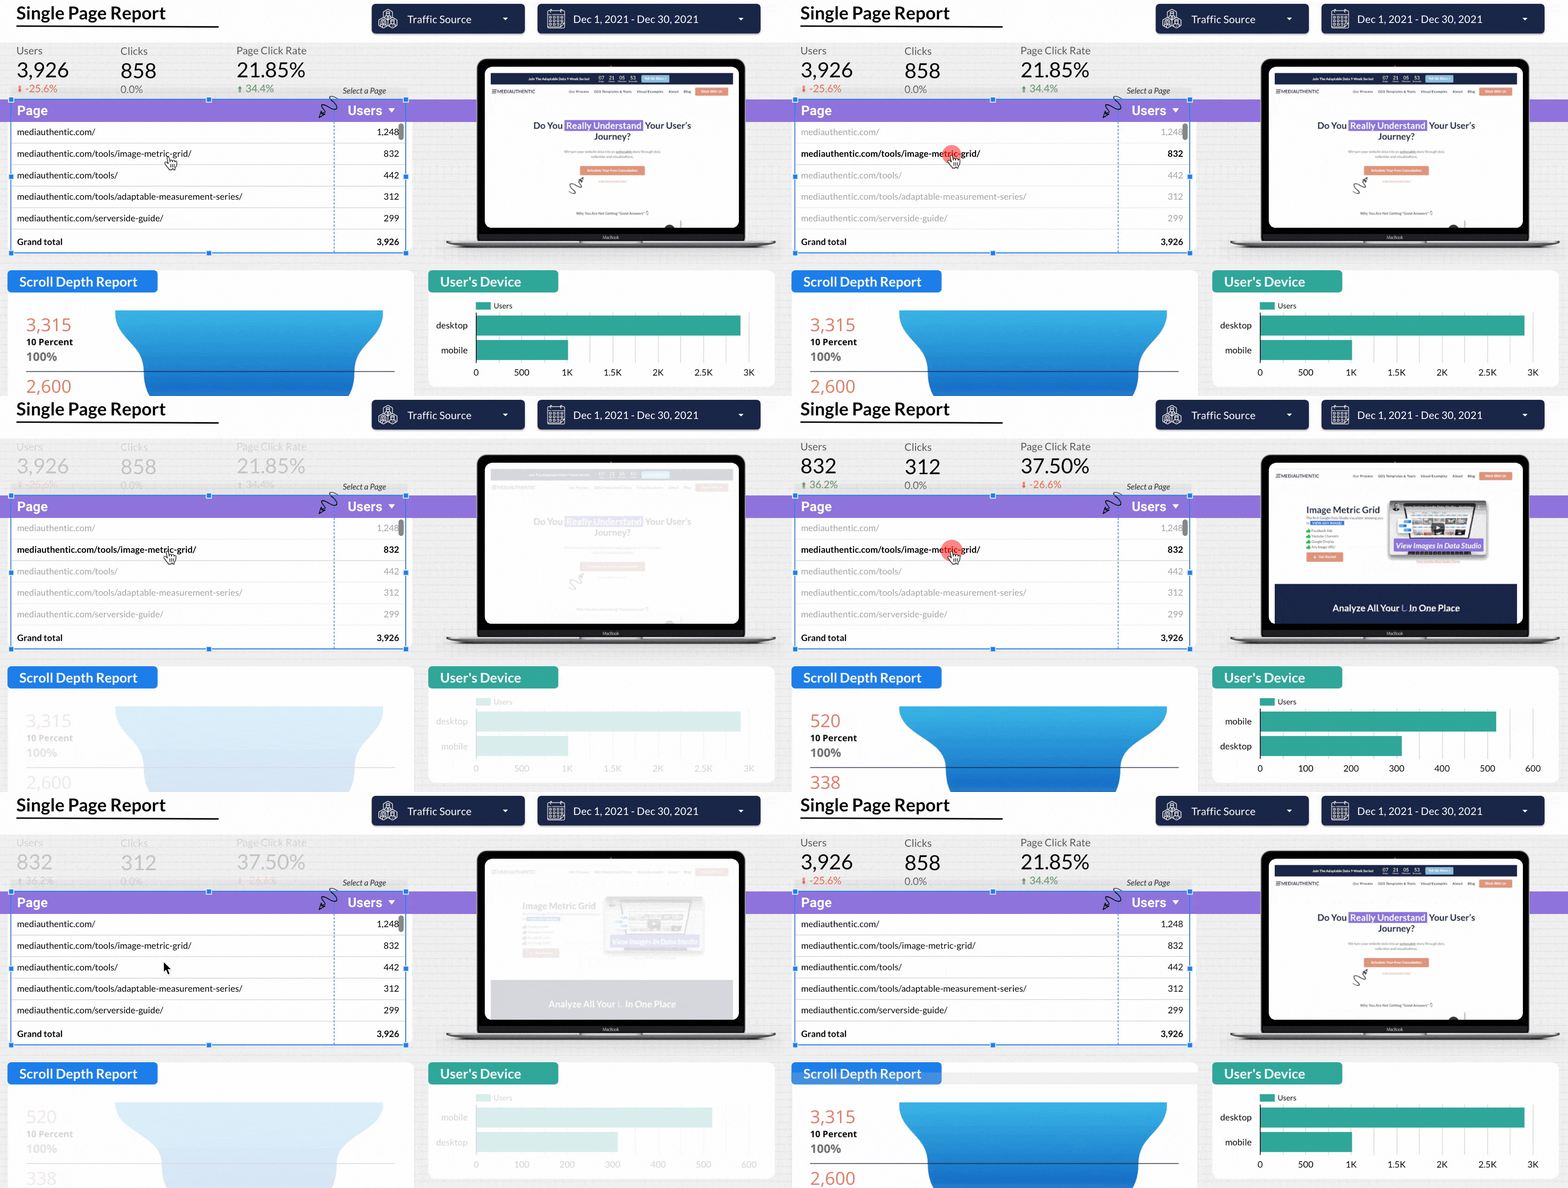
We now have the ability to view interactions with Edit Mode in Looker Studio. You can filter, adjust, and interact with your report while editing, which drastically increases report-building speed!
New Page Icons & Groupings

You now can add icons to your pages & arrange them either on the sidebar or header!
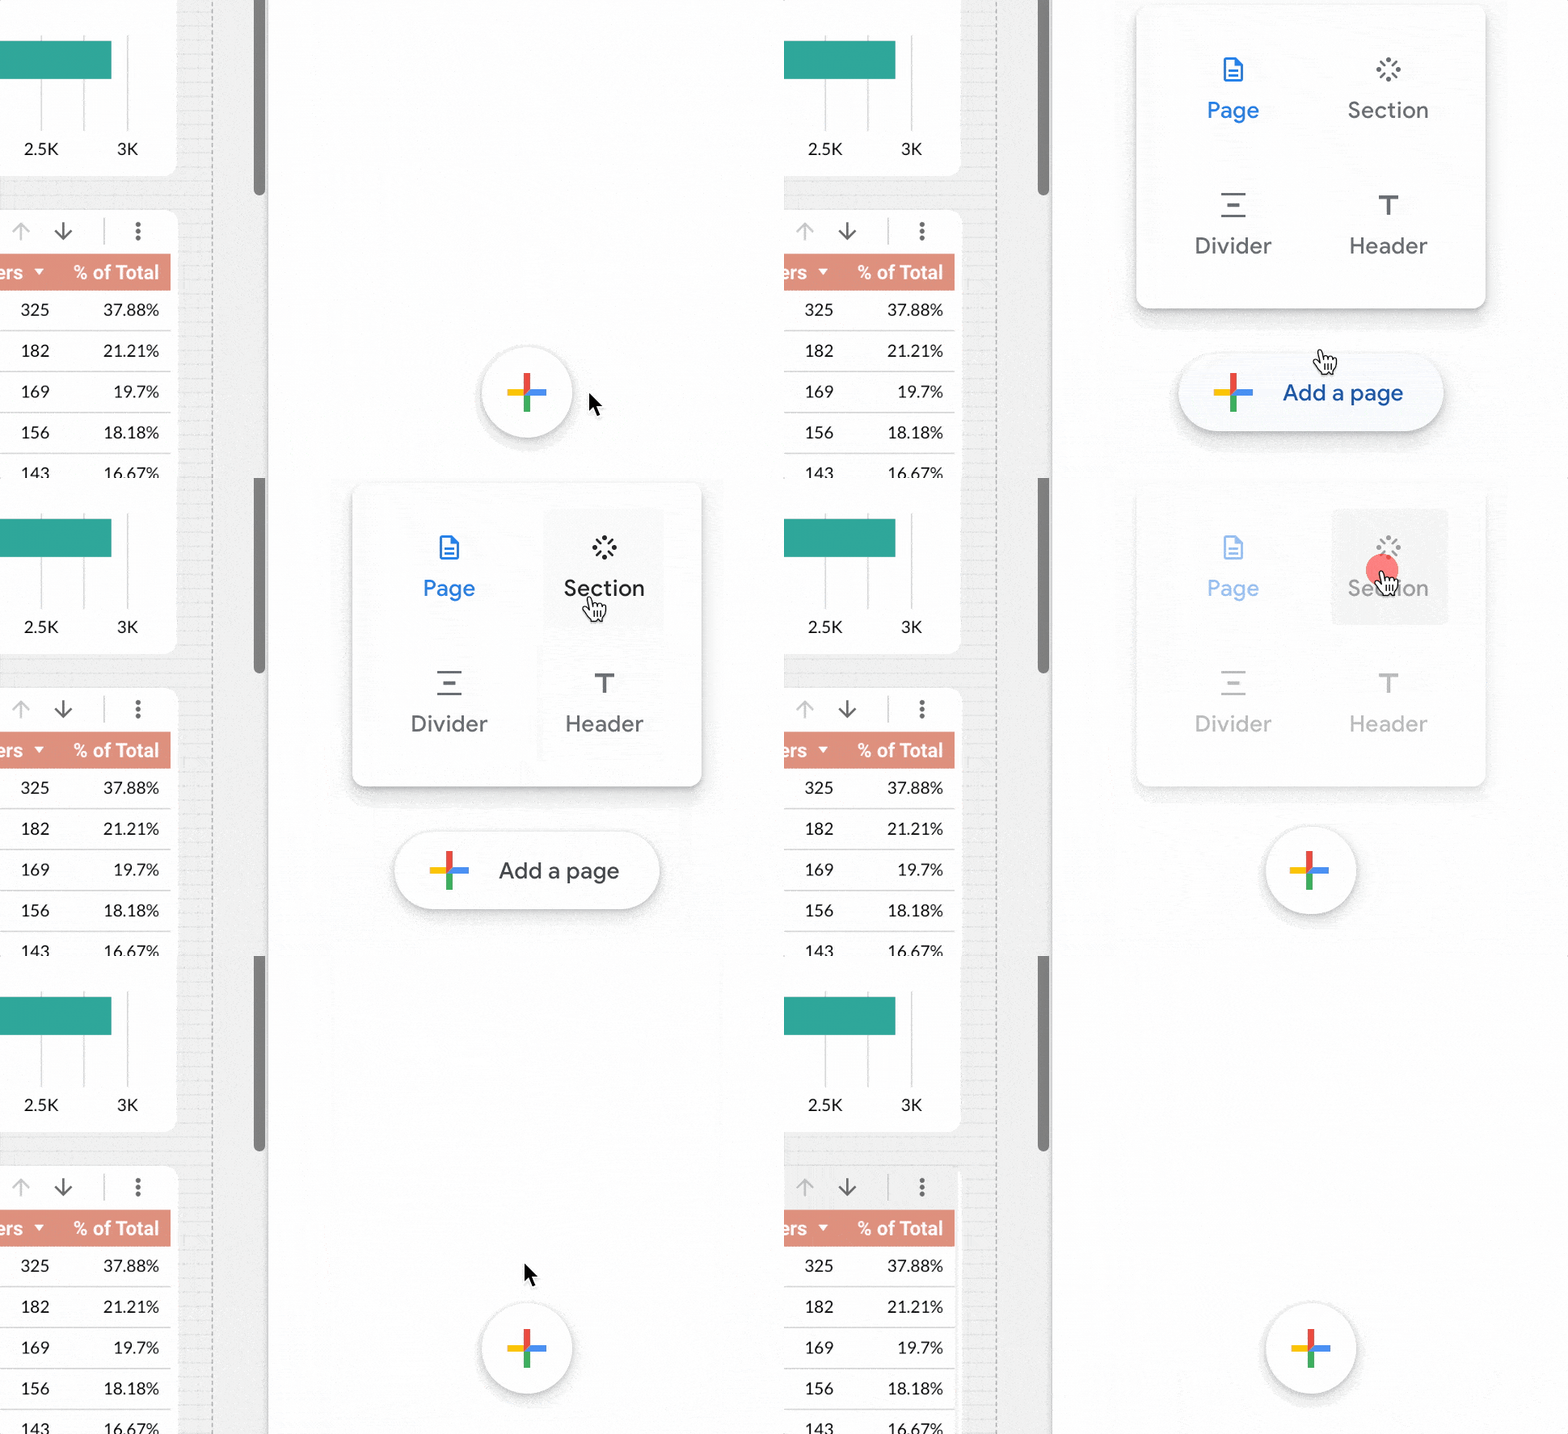
This allows you to easily group pages & build reports that are as intuitive as a website!

Here is an example from our newsletter

Images Now Have Dynamic Links

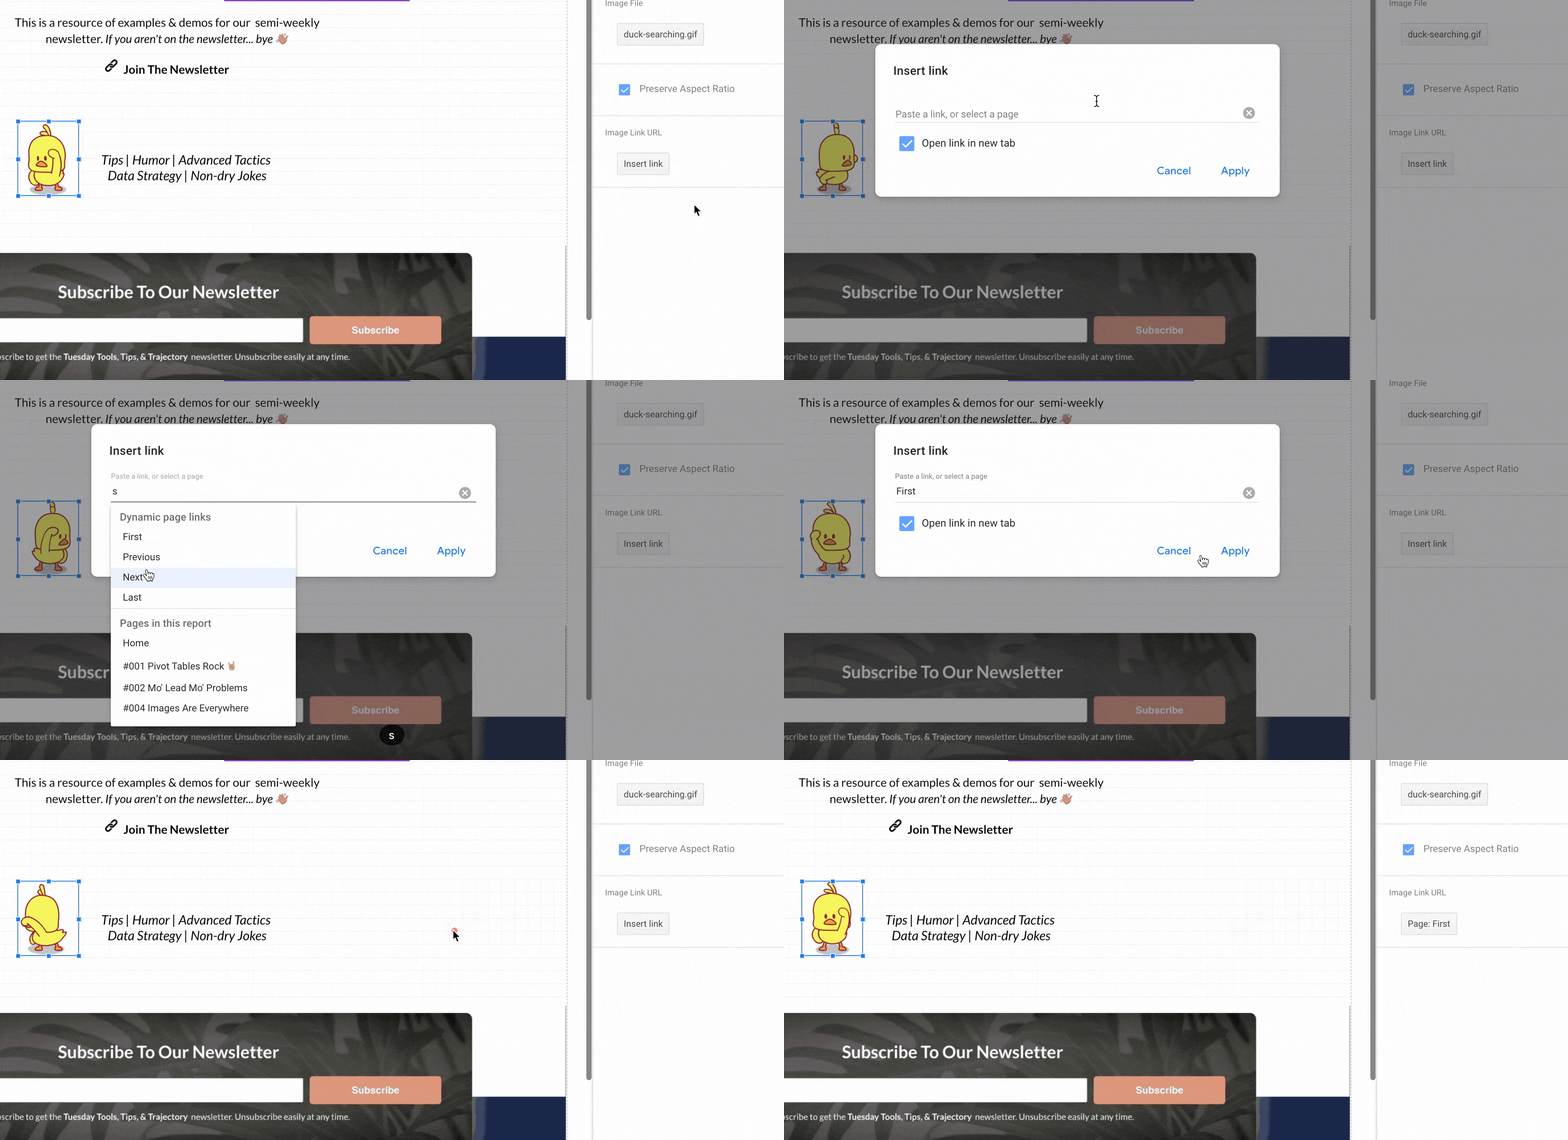
Previously when you tried to link an image, we were only able to use static links.

Now, you can link anything within or outside of Looker Studio!

Ta Da
Build The Perfect Dashboard Every Time

Get your teams, designs & reports standardized across your organization & clients.Β 

Related Article

Keep the learning going with our recommended related articles on similar topics.

πŸ“… Free Live Workshop Live now β–· Replay available

The framework we use to drive revenue using data

Turn your data patterns into revenue. Less reporting on what happened, more action on what to do next.

$1M Challenger brands
$1B Category leaders

The same framework works at every revenue scale β€” the data problem doesn't change.

Enter your email above to save your free spot Β· June 17, 2026, 3:00 PM

Insight Engineering: Driving Revenue First β€” we're live now.

Missed it live? The full replay is playing above.

00
Days
00
Hours
00
Minutes
00
Seconds
until we go live
JJ Reynolds
Hosted by JJ Reynolds
Sharing the exact data framework his team runs with growth clients
  • In this session you'll leave with
  • A way to tell which numbers actually drive revenue, and which ones you can stop reporting.
    The framework for turning one data pattern into a revenue experiment you can ship this week.
    A repeatable system, so acting on insight stops depending on who has time to dig through dashboards.

Trusted by teams at

Days
Hours
Minutes
Seconds

Black Friday OfferπŸ”₯ Get your data audit. Normally $2,500β€”this week only $97. We’ll audit your GA4 stack and jump on a live session to prioritize fixes.