
Does your organization struggle with how to efficiently collect, process, and act on its data (in a reliable way that makes sense to everyone?)
We consistently run into this with clients large and small. That’s ok, it’s what we do. For those of you who do not want to work with us, we put the D.O.O. out into the world, <download here.
The Data Order of Operations (D.O.O.) Framework is our operating system, designed to provide a structured roadmap for data management, consistent alignment, & ongoing insights.
In order to properly use the DOO, you need to understand our Rules of Engagement that guide its implementation.
These rules ensure that your data & your people are aligned with your business goals and that you avoid common pitfalls along the way.
SUPER IMPORTANT: Think of the Rules of Engagement as the principles that ensure you’re not just collecting and analyzing data for the sake of it, but actually using it to take meaningful action.
The Rules of Engagement
The Rules of Engagement – data should empower action, not hinder it. These rules exist to keep your organization moving forward, even when the data isn’t perfect.
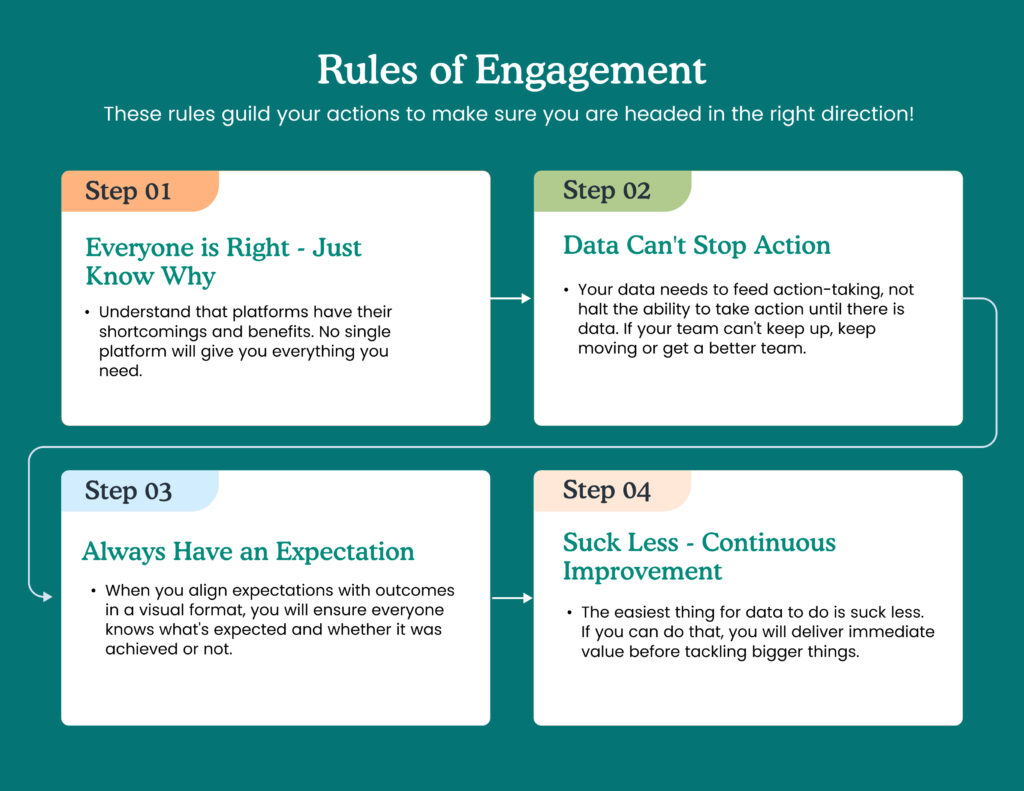
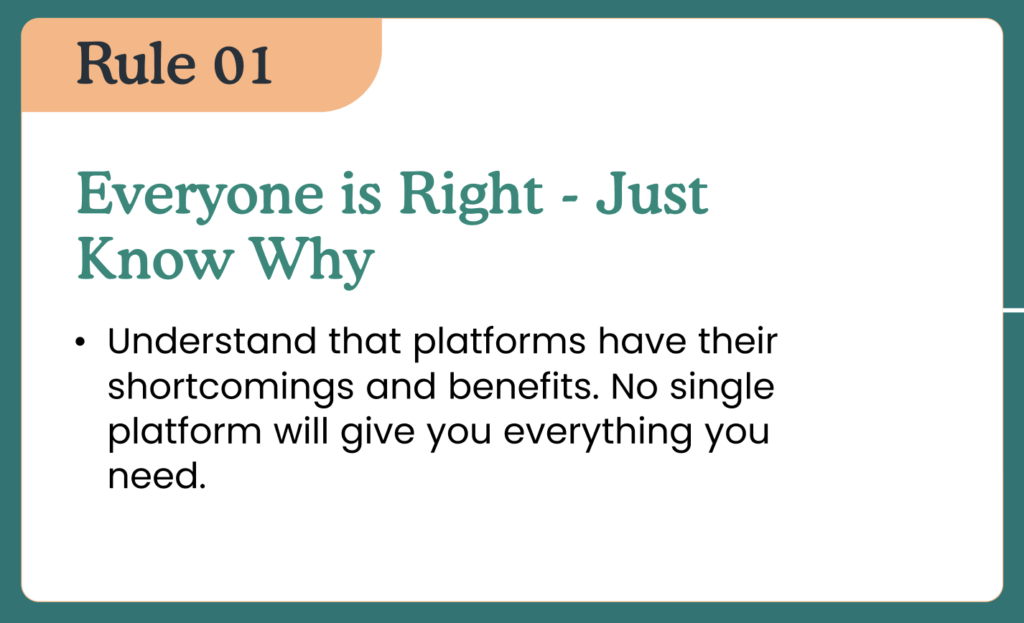
Rule #1: Everyone is Right—Just Know Why
Facebook, Google, Linkedin, Oganic Social, Organic Search & you cat peet all want credit. They can have it, you just need to know why.
This rule makes sure you do not cut people down, but educate around why that perspective is right (in its own way)
Rule #1: Everyone may be right in their own way, but it’s important to understand the reasoning behind each perspective.
Example:
Meta reports 1,000 purchases
Google reports 1,000 Purchases
You only have 1200 Purchases
Now what?
Both perspectives are correct, but by understanding the underlying reasoning behind what data they are reporting, you can make a more informed decision about how to optimize the channel for the entire business outcome.
Rule #2: Data Can’t Stop Action
One of the biggest mistakes companies make is letting data—or the lack of it—halt progress. Data should inform action, not delay it.
If your team can’t keep up with the data, you either need to move forward or find a more efficient way to handle it.
Why This Rule Exists:
In the quest for perfect data, many organizations fall into the trap of waiting too long to take action. The reality is that you will never have perfect data but we can get good enough to act on. The key is to act on the best available information and iterate as you go.
Rule #3: Always Have an Expectation
Data, in and of itself, is meaningless without context.
The first rule emphasizes the importance of aligning expectations with outcomes.
Before you start collecting or analyzing data, ask yourself: What do I want to achieve? Get as granular as you can!
Why This Rule Exists:
Without clear expectations, data can be overwhelming and lead to analysis paralysis.
By defining what success looks like upfront, you ensure that everyone in your organization knows what to aim for and how to measure it. This clarity also helps you avoid wasting time on metrics that don’t matter.
Rule #4: Suck Less = Continuous Improvement
This rule may sound humorous, but it’s incredibly powerful.
The easiest way to improve your data strategy is to make it “suck less.” Instead of aiming for perfection, focus on incremental improvements that deliver immediate value.
Why This Rule Exists:
Many organizations get bogged down by trying to tackle their entire data strategy at once. The reality is that small, continuous improvements can have a compounding effect over time.
By focusing on making things a little better each day (or Less Bad), you can build momentum and drive meaningful change.
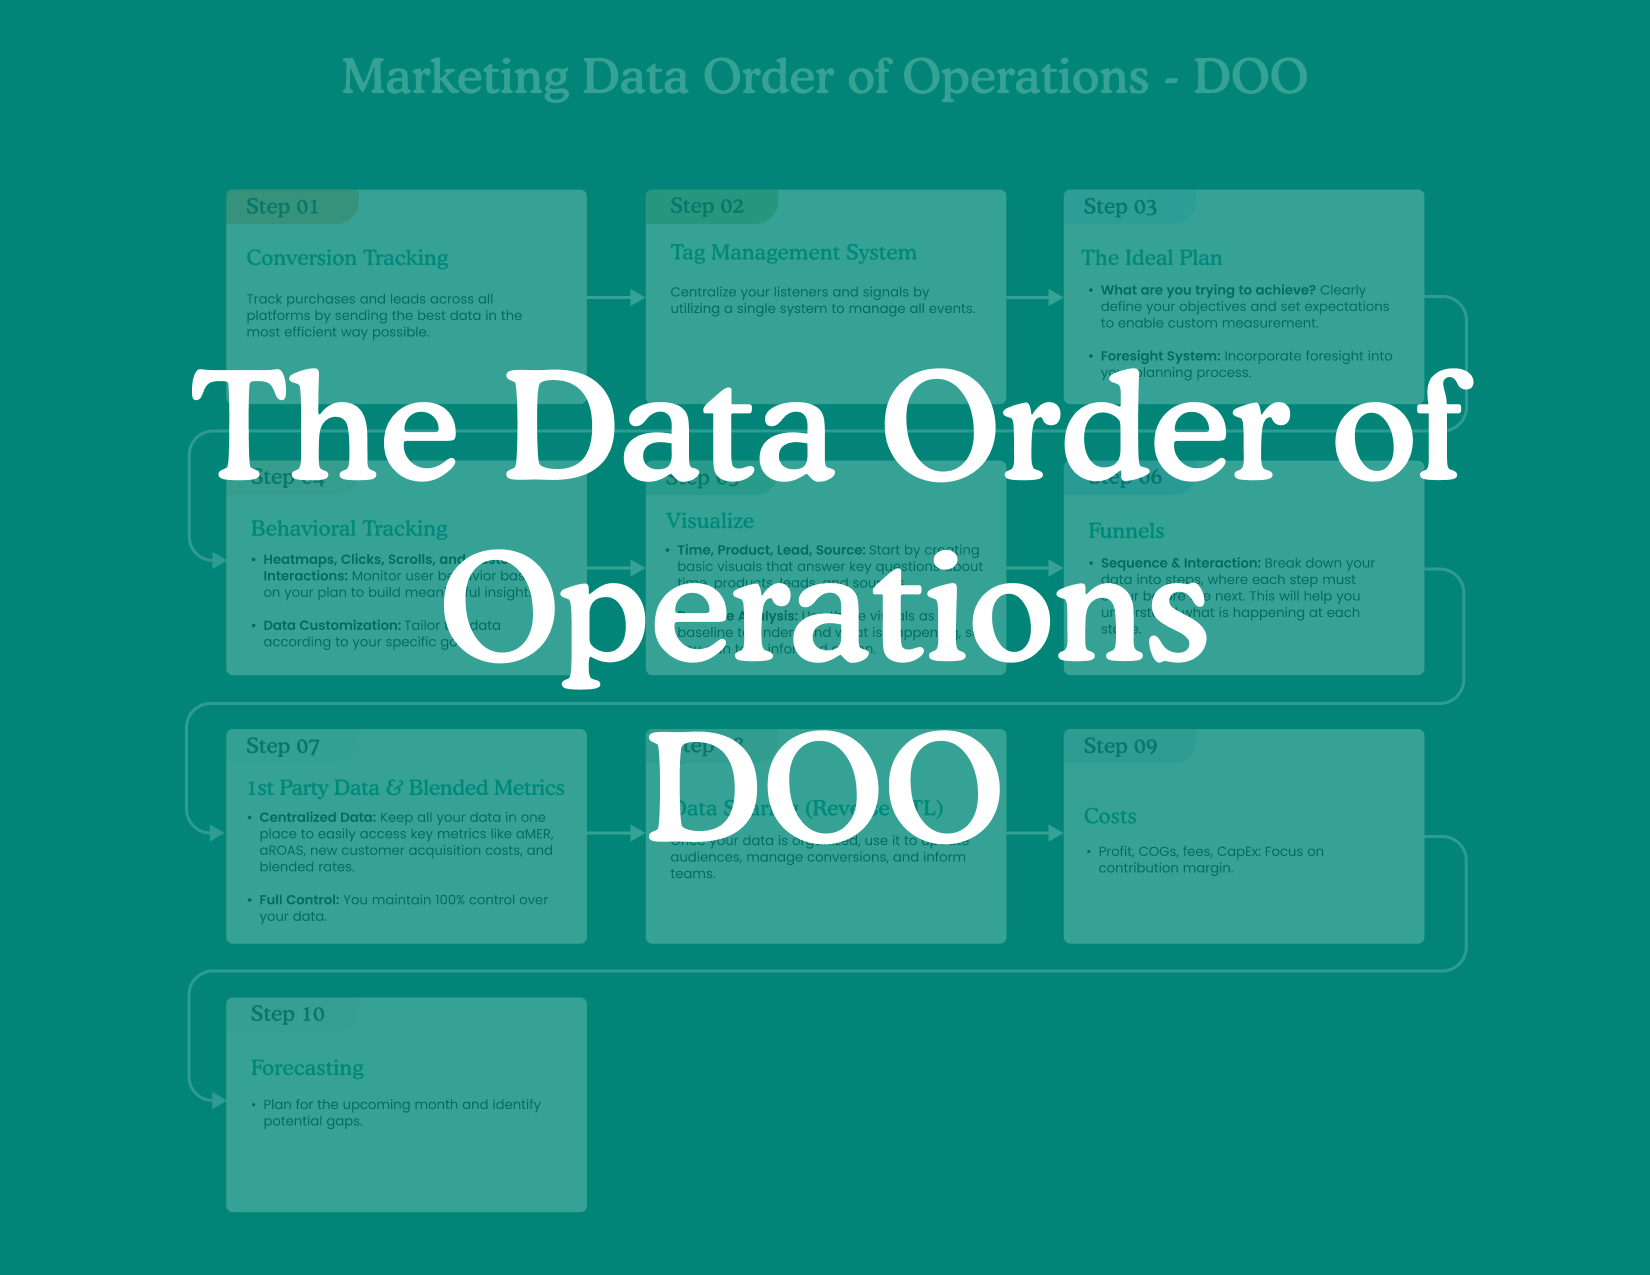
What is the D.O.O. Framework?
Now that we’ve covered the Rules of Engagement, it’s time to dive into the Data Order of Operations (D.O.O.) Framework itself.
The D.O.O. Framework is a systematic approach to managing what you need to do next! This makes sure that businesses extract actionable insights at every stage.
It provides a clear roadmap for how data should be collected, processed, and utilized, allowing organizations to make informed decisions quickly and efficiently.
The D.O.O. consists of 10 key steps, each of which builds upon the previous one.
1. Conversion Tracking: The Must Have
Nothing else matters if you don’t have conversion tracking in place.
Conversion tracking allows you to measure the success of your marketing efforts by sending the outcome (conversion) to all platforms.
You upgrade your conversion tracking over time. This could involve moving from basic browser-based tracking to more advanced server-side tracking, which is more accurate and less susceptible to issues like ad blockers. (privacy compliant… obviously)
2. Tag Management System: Simplifying Data Collection
Once conversion tracking is in place, the next step is to implement a Tag Management System (TMS).
A TMS, such as Google Tag Manager, simplifies the process of adding and managing tracking tags on your website.
Instead of hard-coding each tracking pixel manually (which can be error-prone and time-consuming), a TMS allows you to manage all your tracking tags from a single interface.
This makes it easier to add new tags, modify existing ones, and ensure that all your tracking is consistent across platforms.
3. Planning: Defining Your Intention
With conversion tracking and a TMS in place, it’s time to create a better plan.
Without a clear objective, it’s impossible to know whether your data is telling you what you need to know.
If you’re running a lead generation campaign, your goal might be to break even on lead acquisition costs and generate a profit through follow-up sales.
By defining this goal upfront, you can measure your success and adjust your campaigns accordingly.
Explicitly Say:
- 10,000 people should see my opt-in page
- 4,000 people opt-in
- 1,000 People create an account
- 500 People buy at a 400 AOV
- We try to break even on this & let LTV sustain the business. With this model, we can spend 20 per click & anything below that is gravy.
4. Behavioral Tracking: Understanding User Interactions
This involves tracking how users interact with your website or app, including actions like clicks, scrolls, and custom interactions.
This is for when you plan (Step #3) doesn’t work. What do you do now?
For example, if you’re an e-commerce store, you might want to track how far users scroll down a product page, which buttons they click, and how long they spend on the checkout page.
This data can provide valuable insights into where users are dropping off in the buying process and help you identify areas for optimization.
5. Visualizing Data: Creating Actionable Insights
Visualizing your data is where most people start & fail.
Your By Questions need to be simple to start: Break you plan down by
- Sources
- Product
- Date
- Lead
Start there & Level up.
A simple visualization might show how many leads you’re generating each day, broken down by source (e.g., Google Ads, Facebook Ads, organic search).
This allows you to quickly see which channels are performing best and allocate your budget accordingly.
6. Funnels: Identifying Drop-Off Points
Once you have a baseline understanding of your data visuals it’s time to dive deeper by analyzing funnels.
A funnel is a sequence of events that users go through on their way to completing a conversion, such as visiting a product page, adding an item to their cart, and completing the purchase.
Everyone uses e-commerce as the example, but the big take way here is knowing what a user has seen in their journey.
- Saw Pricing
- Booked Call
- Started Demo
- Purchased
Funnels allow you to improve drop offs for pages, sequences, and other sessions.
7. First-Party Data & Blended Metrics: Owning Your Data
First-party data— is data that you collect directly from your customers (e.g., through website, media platforms, CRMs, interactions or purchase history).
Owning your first-party data is crucial for long-term success, especially as websites & browsers start discarding your data sooner and sooner.
By centralizing your first-party data in a data warehouse (such as Google BigQuery), you can calculate important metrics & have them trended over your entire business, like customer lifetime value (CLV), aMER.
This allows you to make more informed decisions about where to invest your marketing budget.
8. Data Sharing: Put your data to work (Technical Term: Reverse ETL)
Reverse ETL (Extract, Transform, Load). This involves taking the data stored in your warehouse and sending it back to your marketing platforms for activation.
You can programmatically create custom audience in Facebook Ads based on a list of high-value customers from your CRM. This allows you to target your ads more effectively and increase your return on investment (ROI).
or
Programmatically create lead or low engaged audiences where they are in your audience until they are not.
Reverse ETL is a powerful way to activate your first-party data and ensure that your marketing efforts are as targeted and efficient as possible.
9. Knowing Costs In Realtime: Understanding Profitability
As your data infrastructure matures, it’s important to start incorporating cost data into your analysis. This includes not just ad spend, but also the cost of goods sold (COGS), fees, and capital expenditures (CapEx).
Example:
Let’s say you’re running a high ticket coaching business. By factoring in the cost of goods sold and Ad spend, and cost to fulfil, you can calculate your contribution margin—the amount of profit you’re making on each sale after accounting for all costs.
Avoid the company that doubles its revenue & ends up losing money because they didn’t account for rising costs.
Understanding your true profitability is critical for making informed business decisions.
10. Forecasting: Planning for the Future
This involves using historical data to predict future outcomes and plan accordingly.
If you know that your business typically sees a spike in sales during the holiday season, you can use this information to forecast your ad spend and inventory needs for the coming year.
Forecasting is one of the most complex but valuable steps in the D.O.O. Framework.
By accurately predicting future performance, you can make smarter decisions about how to allocate resources and scale your business.
Conclusion: Why Every Organization Needs the D.O.O. Framework
The Data Order of Operations (D.O.O.) Framework provides a clear, step-by-step roadmap for managing and optimizing your data. From setting up conversion tracking to forecasting future performance, the D.O.O. Framework ensures that every aspect of your data strategy is aligned with your business goals.
By following this framework and adhering to the Rules of Engagement, organizations can:
- Improve Decision-Making: With a structured approach to data, businesses can make informed decisions quickly and confidently.
- Enhance Efficiency: Centralizing data and following a clear process reduces redundancy and ensures that teams are working with the most accurate information.
- Drive Continuous Improvement: By focusing on incremental improvements, organizations can deliver immediate value while building towards long-term success.
- Foster Collaboration: By aligning expectations and understanding different perspectives, teams can work together more effectively, leading to better outcomes.
Incorporating the D.O.O. Framework into your organization’s operations is not just about managing data—it’s about building a culture of continuous improvement and data-driven decision-making. Whether you’re a small business or a large enterprise, the D.O.O. Framework can help you unlock the full potential of your data.
Would you like to explore how the D.O.O. Framework can be tailored to your specific needs, or dive deeper into any of the steps? Feel free to reach out, and we’ll help you get started on your journey!