This simple dashboard allows you to easily plug your Google Analytics account in and start visualizing your data.
Please Note: You must have e-commerce data reported into your Analytics account otherwise many of the charts will not work.
View Data Studio Template Report
What Is The Purpose of The Report?
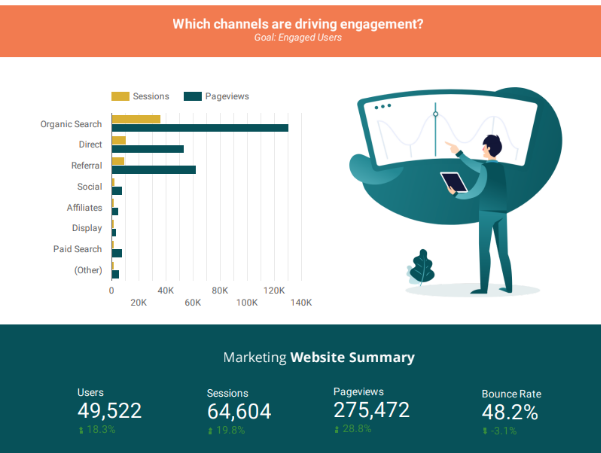
We built this to give any business a quick insight into their own analytics. There are many caveats to this, but it will give you a “good enough” perspective to give you some insights.
Its meant to help you identify your “Big 5”.
1. Revenue:
You need to know how much money you are making. That’s a Fact. If you do not know that, stop reading and go log into Quickbooks or your bank account. Then come back 🙂
2. New Leads:
How many new people are you adding to your system? Even if you just have a monthly newsletter, make sure you track this. As you grow, you can track leads on different systems. Push notifications, Email opt-ins, phone directories, CRM, etc.
Read this whole blog just on Lifetime Value
3. Conversion Rate:
This is a little bit of a cop-out, but you need to know your conversion rate at each step of your processes. Pageview > Email opt-in, Salespage > Purchase, Lead > Transaction.
If you do not know those numbers, what happens when you stop getting transactions? What broke? uh oh…..
4. MRR:
You should try to have some sort of monthly recurring revenue. I’m not talking about building your own SAAS product, but maybe a basic plan on a subscription. Regardless, know how much money you are expected to receive next month on autopilot. Read more about MRR
5. Average Order Value:
What is the “Average” revenue you receive per transaction or client? Does that fluctuate seasonally? If you know this, you can mitigate growth stalling during seasonality and as you start to grow.
How To Get This Report For Your Business.
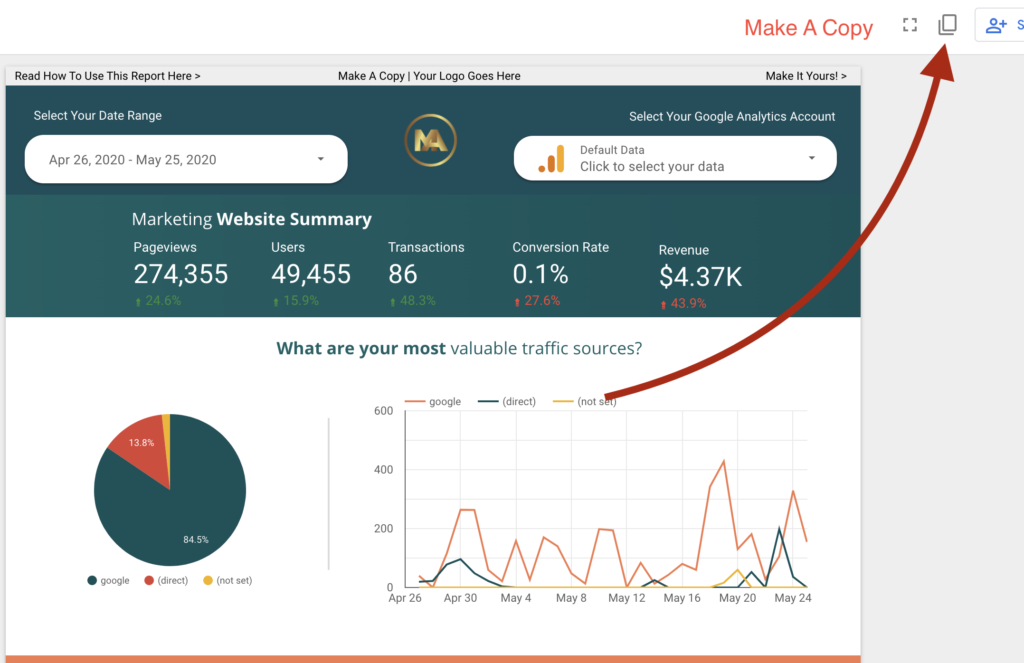
Step 1: Make a copy or just use it.
The report by default uses google’s demo account that you can use to “play around” with data. To use your data, you can simply select the data source. If you would like to use your branding, then you need to select “use template”
Get your copy of the report here >
Step 2: Select Your Data Source.
At the top right of the screen you will see a drop-down that has the Google Analytics Symbol. You will need to use that to select your google analytics account. Otherwise it will not work.
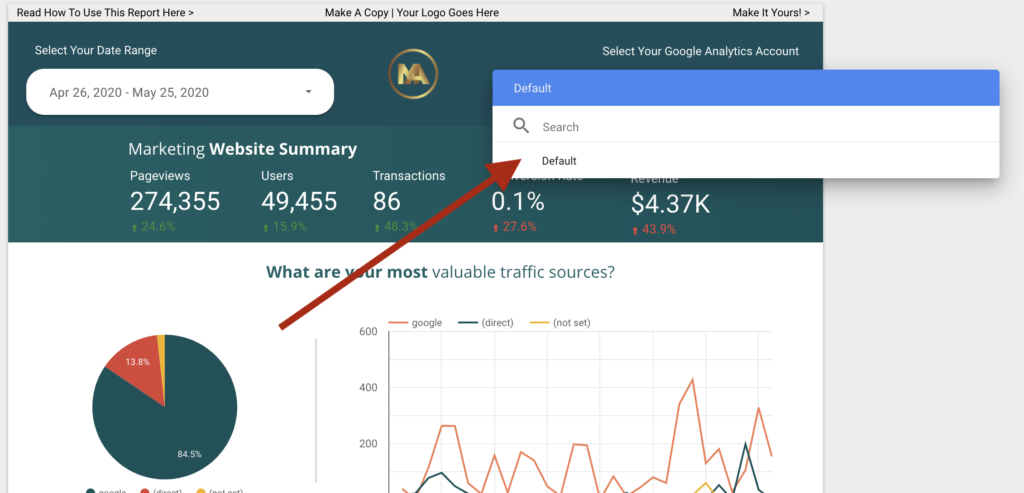
Simply click the drop-down and select your Google Analytics view.
Note: You must be logged in to the same Google account which has access to your websites analytics view while you are viewing the dashboard.
What is a google analytics view? Read how to find that from google.
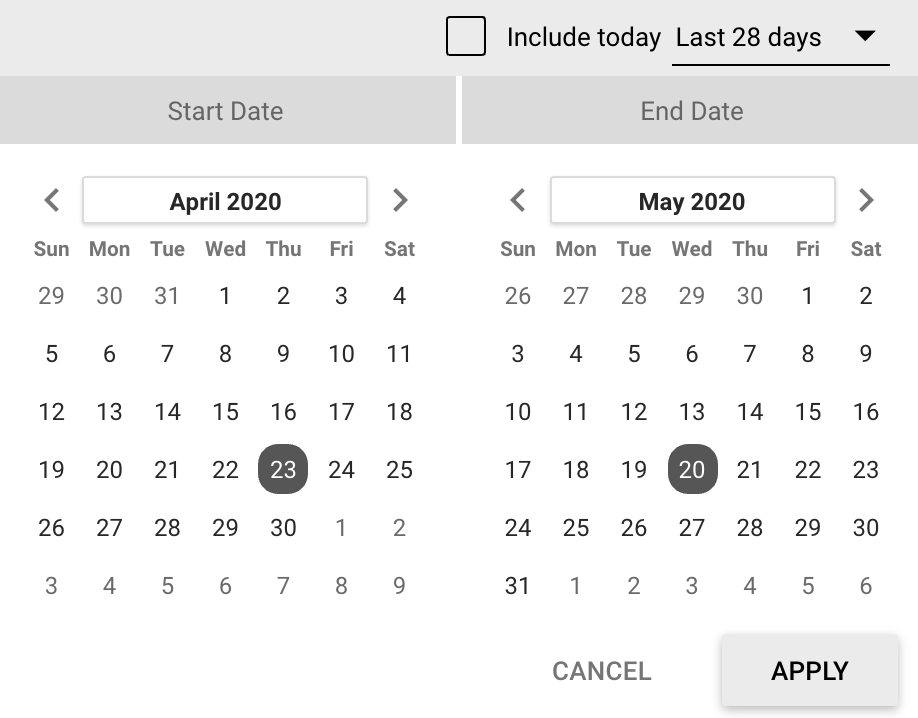
Step 3: Select Your Date Range
Use the big date field to select the dates that are most applicable to you. All of the data on the chart will update.
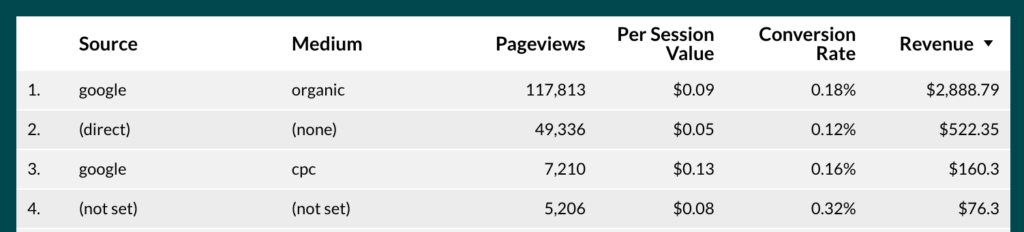
Step 4: Go Deeper
All of the fields in the report are filters. You can select them to filter the entire dashboard by your criteria of only people who came from (a) Facebook and had (b) revenue of greater than $1000/transaction
Step 5: Make It Your Own
You can feel free to customize your columns, colors, reports making sure it’s working for you!

We would love it if you kept the Mediauthetic footer, but that is no big deal!