
Track conversion paths and find drop-off points PostHog funnels turn event data into action. Here’s how to build, analyze, and use funnels to improve your product or marketing outcomes.
What PostHog funnels solve
Use funnels when you need a defined start point, end point, and sequential steps.
Funnels answer specific questions:
- Which step loses the most users?
- What behaviors predict conversion?
- Who drops off, and can you re-engage them?
How to build your first funnel
Start with a clear path. You need three things: entry event, conversion steps, and target outcome.
Example 1: SaaS product funnel

Here’s how to track a typical software signup flow using HelloConversions.com as the model.
Step 1: Define your entry point
Set the first step to capture page views on your pricing page:
- Event:
page view - Filter: Current URL
containspricing
Use contains instead of exact matches. URLs often carry query parameters (fbclid, gclid, UTM tags). Exact matching breaks when parameters change.
Step 2: Add conversion steps
Next steps track meaningful actions:
- Step 2:
account created(use PostHog actions for flexibility) - Step 3:
destination created(the activation event)
Actions update automatically across all funnels when you modify their definition. Use them for events you’ll reference often.
Step 3: Review the results
Over 90 days, this funnel might show:
- 94 people viewed pricing
- 9 created accounts (9.6% conversion)
- 6 connected a destination (6.4% overall, 66.7% from account creation)
Now you know where to focus. If step 2 loses 90% of viewers, your pricing page needs work. If step 3 loses 33%, investigate the onboarding flow.
Example 2: Marketing funnel
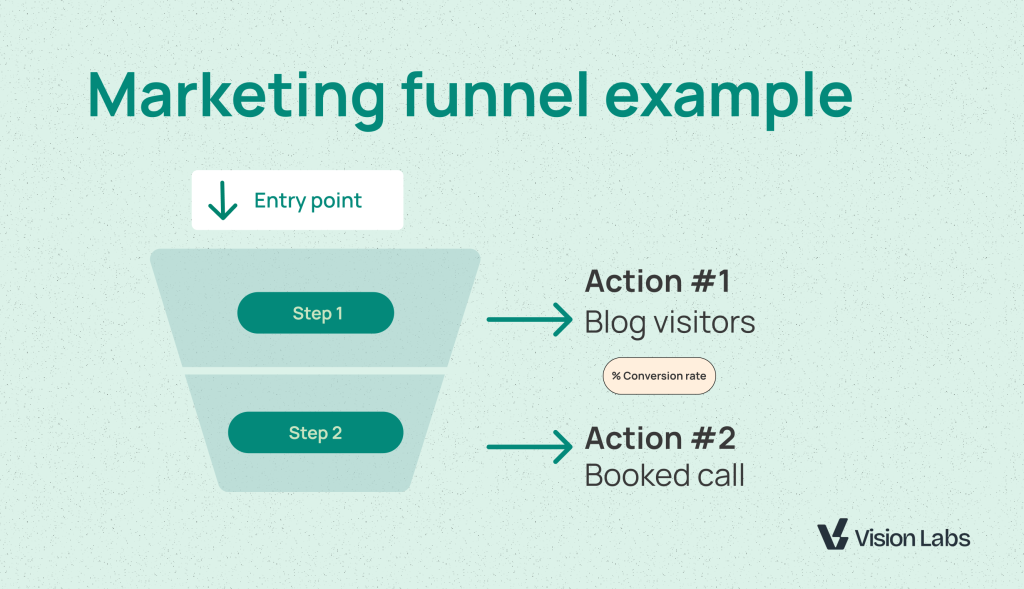
Track content engagement to contact page visits using VisionLabs.com data.
Step 1: Set the entry event
Capture blog readers:
- Event:
page view - Filter: Current URL
containsblog
Step 2: Define the target outcome
Track contact page visits:
- Event:
page view - Filter: Current URL
containscontact
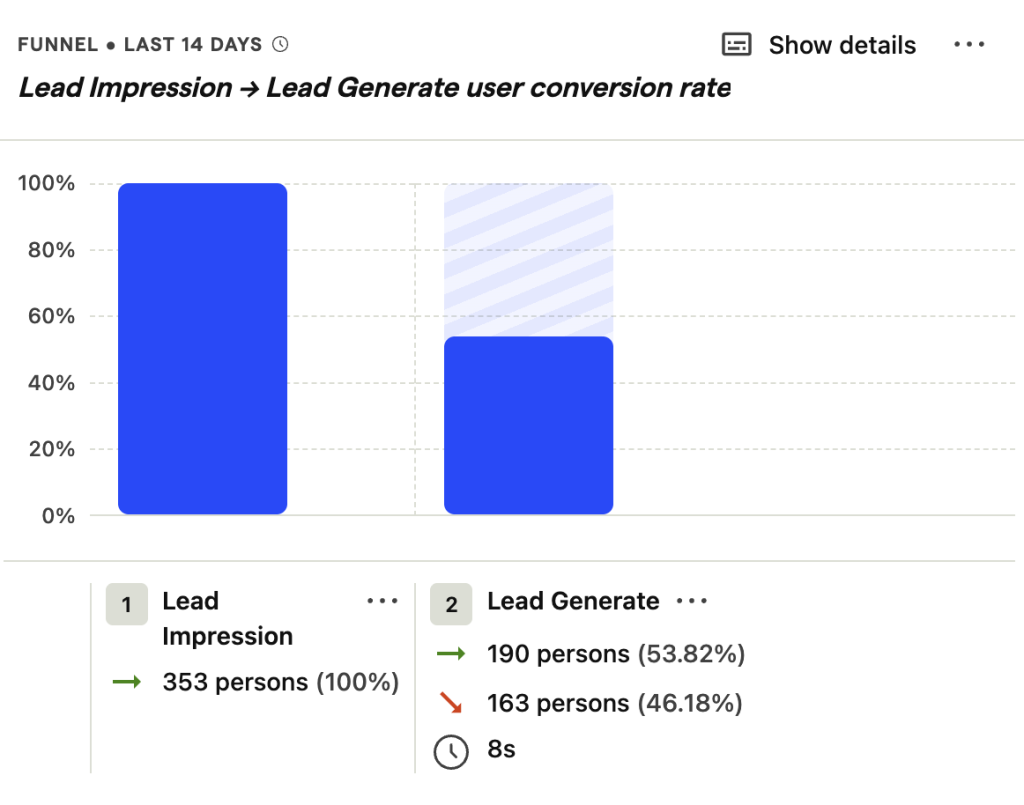
Results over 7 days:
- 180 blog visitors
- 2 contacted (1.1% conversion)
This tells you whether blog content drives leads. If conversion is low, test different CTAs or improve content-to-offer alignment.
Correlation analysis: find what drives conversion
Correlation events show which behaviors predict success. PostHog runs statistical analysis to surface patterns you’d miss manually.
How to use correlation analysis
After building your funnel, scroll down and click “Load results” under correlation events.
PostHog shows:
- Events that successful users performed more often
- Properties that correlate with conversion
- Behaviors that predict drop-off
Example insights:
- Users who triggered “trial started” were 90% more likely to connect a destination
- Chrome users converted 15% more than Safari users
- “Customer created” events always preceded destination creation (dependency check)
Use these insights to:
- Identify required setup steps users skip
- Find technical issues (browser-specific bugs)
- Prioritize features that drive activation
Pro tip: Correlation works best with volume. If you’re analyzing fewer than 100 conversions, patterns may not be statistically significant.
Force events for better correlation
Create custom events for key moments:
lead_impression: page loaded with lead magnet visiblesurvey_dismissed: user closed feedback promptcontent_viewed: user scrolled past 50%
These events give correlation analysis more signals to work with.
User paths: explore open-ended journeys
Funnels require predefined steps. User paths let you explore without assumptions.
When to use user paths instead of funnels
Choose user paths when:
- You don’t know the conversion path yet
- Multiple routes lead to the same outcome
- You want to see where users go after a specific action
Funnels are for testing hypotheses. User paths are for generating them.
How to build a user path analysis
Step 1: Set the starting point with wildcards
Instead of one specific URL, use wildcards to capture categories:
- Start:
visionlabs.com/blog/*(any blog post) - Or:
visionlabs.com/academy/*(any academy page)
Wildcards let you see patterns across content types.
Step 2: Configure path settings
Adjust these controls:
- Steps: Start with 3-4 to keep it readable
- Max paths: Limit to 10-15 for clarity
- Min/max people per path: Filter noise by setting a floor (e.g., 4-50 users)
Step 3: Analyze the flow
PostHog visualizes where users go next:
- Blog → homepage (25 users)
- Blog → contact (12 users)
- Blog → pricing → contact (8 users)
This reveals natural navigation patterns and unexpected detours.
Remove URL parameters for cleaner paths
Use regex grouping to strip query strings:
Pattern: \?.*
This groups all URLs by path alone, ignoring UTM tags and click IDs. Cleaner data, clearer patterns.
Note: PostHog uses RE2 syntax. No escape slashes needed.
Add funnels to dashboards
Funnels are most useful when you check them regularly, for that you need to setup a dashboard
How to create a funnel dashboard
Step 1: Save your funnel
Click “Save” after configuring your funnel. Give it a clear name: “Pricing to activation” beats “Funnel 3.”
Step 2: Create a new dashboard
Go to Dashboards → Create new → Blank dashboard.
Step 3: Add the funnel as an insight
Click “Add insight” and select your saved funnel. It appears as a visual card.
Interact with dashboard funnels
Hover over any step to see:
- User count at that step
- Conversion rate from previous step
- Overall conversion rate
Change the date range to see trends:
- Last 7 days for quick checks
- Last 90 days for seasonal patterns
Click on a drop-off step to see who left. PostHog shows individual users or creates a cohort for retargeting.
View correlation from dashboards
Dashboard cards don’t show correlation by default. Click the funnel card to open the full insight view, then scroll down to load correlation events.
This keeps dashboards clean while preserving deep analysis one click away.
Export drop-off cohorts for action
Find users who dropped off, then re-engage them.
Step 1: Click the drop-off number
Select the step where users left (e.g., “1 person dropped off between steps 2 and 3”).
Step 2: View the user list
PostHog shows individual users with their:
- Email (if you’ve called
identify) - Properties (browser, location, custom traits)
- Full event timeline
Step 3: Create a cohort
Save these users as a cohort. You can:
- Send them to email automation tools
- Alert your support team
- Trigger personalized outreach
This closes the loop from analysis to action.
Funnels vs user paths: decision guide
Both tools analyze conversion. Here’s when to use each:
Use funnels when:
- You know the ideal path
- Steps are sequential (A must happen before B)
- You want to compare conversion rates over time
- You need correlation analysis
Use user paths when:
- You’re exploring behavior
- Multiple paths are valid
- You want to see where users go after an action
- You need to visualize navigation patterns
Combined approach:
- Start with user paths to discover common routes
- Build funnels to track and optimize those routes
- Use correlation to understand why some users convert
Most teams use funnels 80% of the time. User paths help when you’re stuck or exploring new features.
Common funnel mistakes to avoid
Using exact URL matches
Exact matches break when query parameters change. Always use contains for URL filters.
Skipping correlation analysis
Correlation reveals dependencies and blockers. Load results even if your funnel looks fine—you’ll find optimization opportunities.
Too many steps
Funnels with 6+ steps are hard to action. If your flow is complex, create multiple 3-4 step funnels that zoom in on specific segments.
Not using actions
Events are static. Actions are dynamic. When you update an action definition, all funnels using it update automatically.
Ignoring low volume
Correlation needs at least 50-100 conversions to find reliable patterns. If your funnel converts 5 users, focus on driving more volume before optimizing steps.
What to do next
Start with one funnel:
- SaaS product: pricing view → signup → activation
- Marketing: content page → contact form
- Ecommerce: product page → cart → checkout
Build it, let it run for a week, then check correlation. Find one insight and act on it.
Funnels work when you close the loop from data to decision.