
If you’re running a SaaS company or ecommerce brand and your analytics live in GA4, Mixpanel, Hotjar, and three other tools that don’t talk to each other, this guide is for you.
PostHog can replace most of that stack. Or work alongside it. Either way, you’ll have marketing and product data in one place.
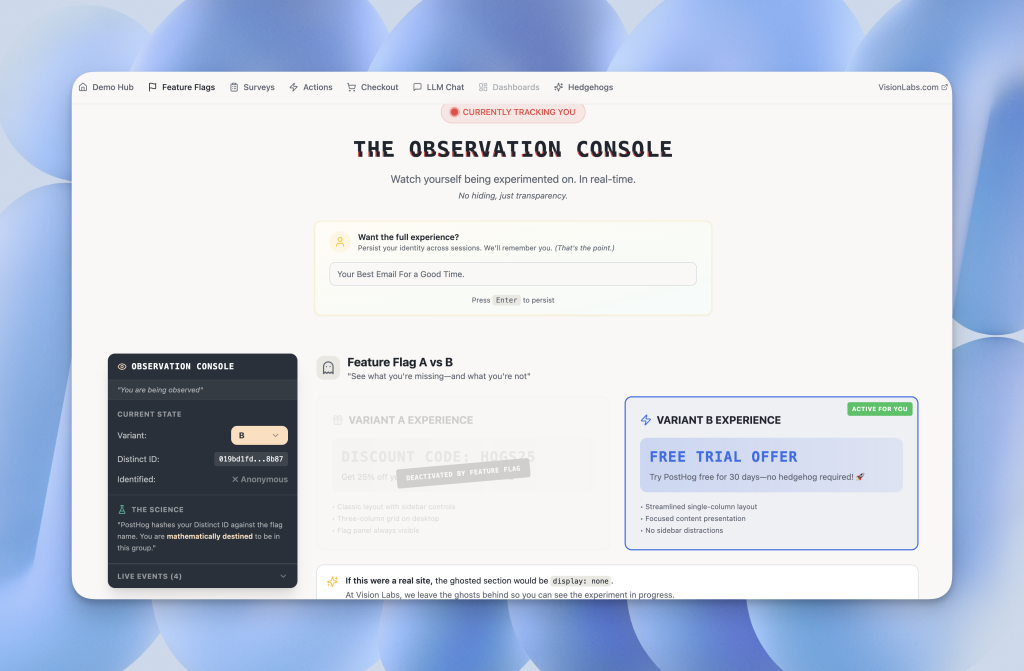
We made a PostHog Demo page to show you how it works in a live experience
This tutorial walks through the core PostHog features that create the most value:
- Product analytics and dashboards
- Web analytics (the GA4 alternative)
- Session replays (without breaking budget)
- LLM analytics for AI cost tracking
- Data pipelines and destinations
- Workflows for automated notifications
- Surveys for in-app feedback
- Notebooks for team documentation
We skip feature flags, experiments, and heat maps. Those layer on after you nail the foundations.
The Problem Is That Your Data Lives in Too Many Places
Most teams piece together analytics from disconnected tools.
Marketing uses GA4. Product uses Mixpanel. Nobody trusts the overlap. Hotjar or FullStory bills climb while 90% of recordings go unwatched. You see pageviews but can’t tie them to conversions, LLM costs, or retention.
PostHog consolidates product analytics, web analytics, session replays, surveys, LLM tracking, and data pipelines into one platform. You stop exporting CSVs between tools and start making decisions from a single source of truth.
PostHog Product Analytics: Build Insights That Feed Dashboards
Product analytics in PostHog are individual components that combine into dashboards. Think of each insight as one chart answering one question.
Creating Your First Insight
Go to Product Analytics > New Insight and choose a report type: Trends, Funnels, Retention, User Paths, or Lifecycle. Configure your event and filters, then save and add to a dashboard.
Trends show event volume over time, but the name misleads. You can also display data as tables, pie charts, or scorecards (single numbers). For a KPI dashboard, select Number display to show total counts.
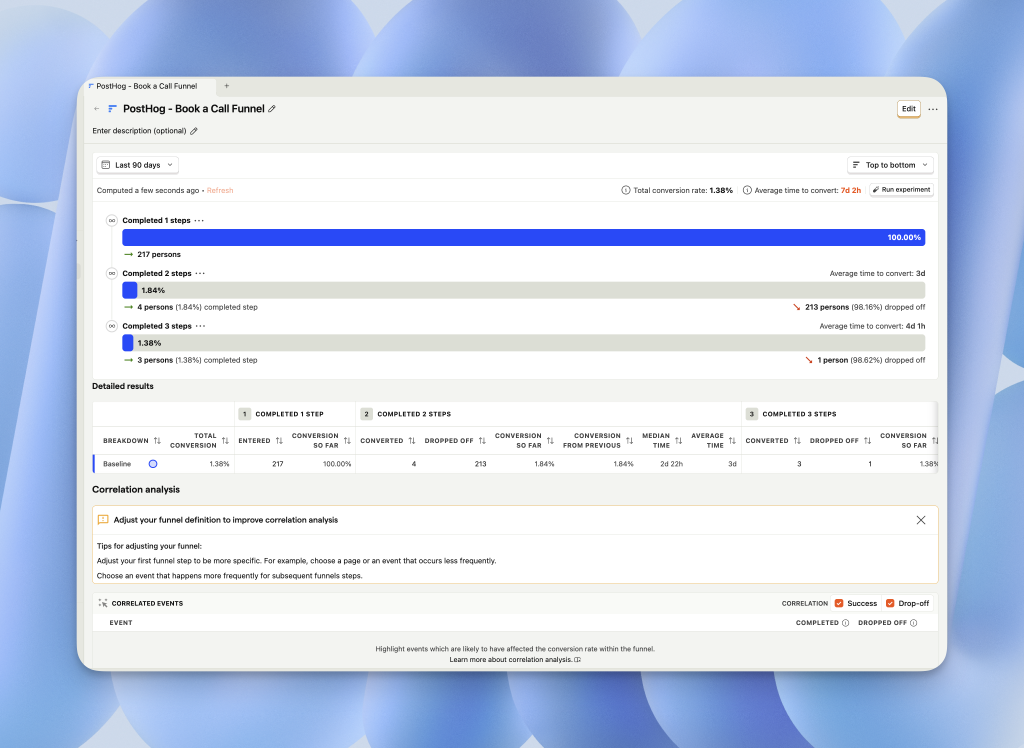
Funnels: Track Drop-Off and Find Correlations
Funnels reveal where users abandon a flow and why.
Set up a funnel from pageview to purchase, then scroll to the Correlations section. PostHog automatically surfaces which user properties or events correlate with conversion. This replaces hours of manual SQL. If you store user tiers or acquisition sources as properties, correlations show which segments convert best so you can double down on what works.
Use top-to-bottom funnel layouts. They’re easier to read than left-to-right charts. (See our PostHog funnels guide for more setup tips.)
Retention: Measure Who Comes Back
Retention reports answer: “Of the users who did X, how many returned to do Y?”
Use retention to track feature adoption over time, cohort performance by acquisition source, and onboarding completion rates. Add filters by source, feature flag, or user property to segment results. This is one of PostHog’s most powerful features for product teams measuring stickiness.
PostHog Dashboards: Combine Insights Into a Single View
Dashboards group multiple insights. Once you save an insight, add it to a dashboard via Add Insight.
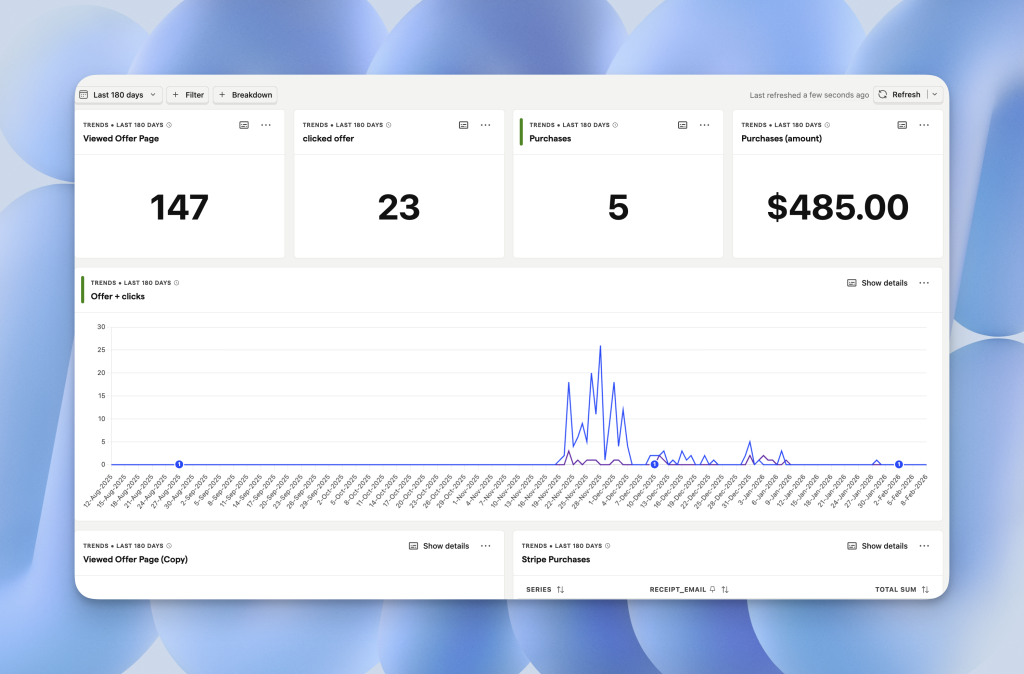
Dashboard Organization Tips
Group dashboards by function using folders and tags: Acquisition, Onboarding, Adoption, Revenue (the SOAR framework). Press “E” to edit layout and resize or rearrange charts. Add text blocks to annotate dashboards with context like “Blog traffic dropped Jan 24” to keep stakeholders informed. Our PostHog dashboards guide covers more organization strategies.
Watch Out: Global Filters Can Confuse
Dashboard-level filters (date range, cohort, breakdown) apply to every chart. If a chart doesn’t have the filtered property, results break.
Build dashboards around a consistent set of properties. Avoid global breakdowns. They create visual chaos.
PostHog Web Analytics: A Built-In GA4 Alternative
PostHog’s web analytics tab gives you a pre-built dashboard with visitors, pageviews, bounce rate, session duration, referrers, and geography. No configuration required.
Think of it as GA4 out of the box.
When to Use Web Analytics vs. Dashboards
Use the Web Analytics tab for quick marketing snapshots. Use custom dashboards when you need filtered cohorts (only users with emails), combined product and marketing data, or charts that don’t exist in the default view.
Page Reports: The Underrated Feature
Page Reports (currently in beta) analyze a single URL. Select any page and see entry and exit paths, previous and next pages in the journey, referring channels and outbound clicks.
This is “page sniper” analysis. Zoom in on one URL instead of the whole site. Use it to diagnose landing page performance or track campaign-specific pages.
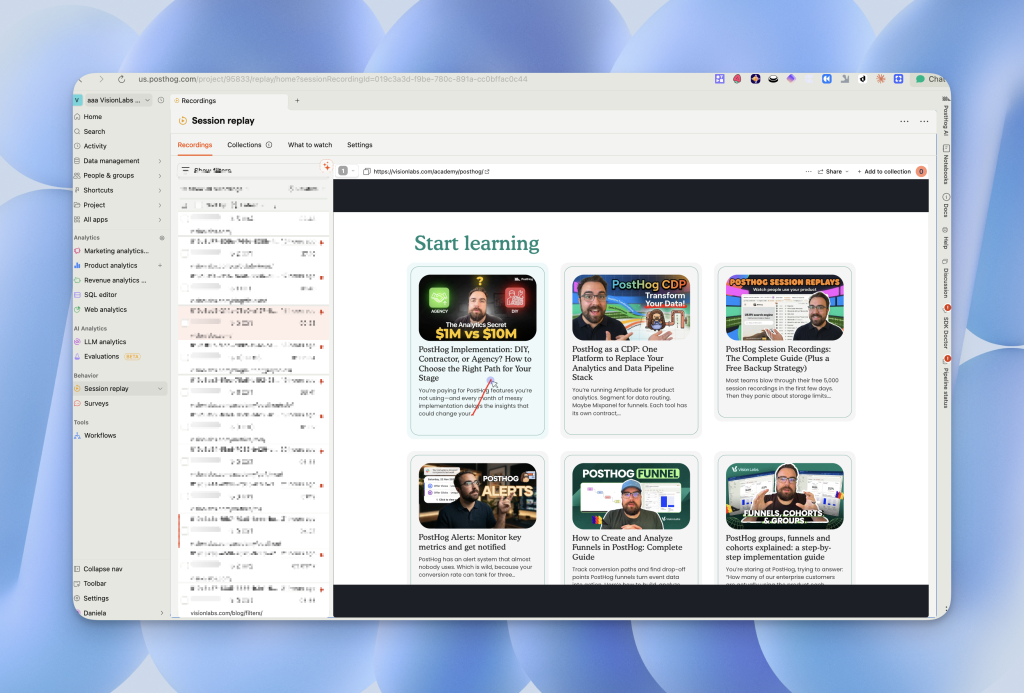
PostHog Session Replays: Watch Users Without Blowing Budget
Session replays show exactly what users do: clicks, scrolls, rage clicks, console errors. PostHog includes 5,000 free replays per month.
Finding Replays
If session replays aren’t in your sidebar, go to All Apps, search for “Session Replays,” and pin it to your navigation.
Reducing Replay Costs With Sampling
High-traffic sites burn through 5,000 replays fast. Go to Settings > Replays and set Sampling to 10-20%.
At 50,000 monthly sessions, 10% sampling gives you 5,000 replays spread across the entire month instead of using your quota in the first week.
You can also use Microsoft Clarity alongside PostHog for unlimited free replays. Reserve PostHog replays for product-specific debugging. For more detail, see our complete guide to PostHog session recordings.
PostHog LLM Analytics: Track AI Costs by Model and User
If your product uses OpenAI, Anthropic, or any LLM provider, PostHog tracks token usage and costs automatically.
What LLM Analytics Shows
You get total cost by model (GPT-4, Claude, etc.), input vs. output tokens per generation, cost per user or session, and error rates and latency.
Setting Up LLM Tracking
Wrap your LLM calls with PostHog’s SDK. Each API call sends token counts, model name, and cost to PostHog as an event. The data feeds into standard dashboards so you can answer “Which users drive the most AI spend?” or “Is our GPT-4 usage profitable?”
PostHog Data Pipelines: Send Events to External Tools
PostHog’s Destinations push events to external platforms in real time.
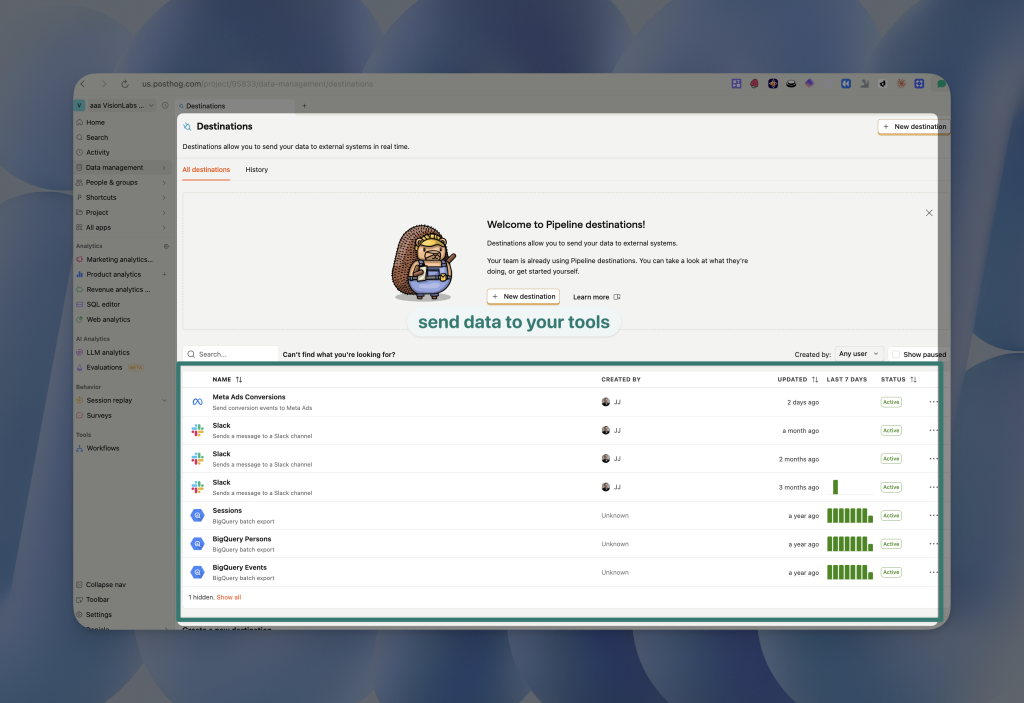
Top 3 Use Cases for Destinations
CRM sync: Send signup or conversion events to HubSpot or Salesforce so sales sees product activity.
Slack alerts: Notify your team when key events fire like new trial, upgrade, or churn signal.
Ad platform optimization: Push conversions to Meta’s Conversions API (CAPI) to improve ad targeting.
Meta Conversions API Setup
The Meta CAPI destination is marked “experimental” but works reliably. Configure it to send purchase or signup events back to Meta so your ad campaigns optimize on real conversions, not just pixel fires.
Watch for deduplication and timestamp handling. Test in Meta’s Events Manager before going live. We walk through the full setup in our PostHog to Meta events guide.
PostHog Workflows: Automate Emails and Slack Messages
Workflows trigger actions based on events. A typical setup: a trigger when user completes an event (like email capture), an action to send an email and post to Slack, and an exit when user achieves a goal (like completes onboarding).
When to Use Workflows vs. a CRM
Workflows handle simple, event-driven automations. For complex sequences like drip campaigns, lead scoring, or multi-branch logic, use a dedicated tool like HubSpot or Customer.io.
Ask yourself: Will we maintain this automation in PostHog forever? If the answer is “probably not,” build it in your CRM from the start.
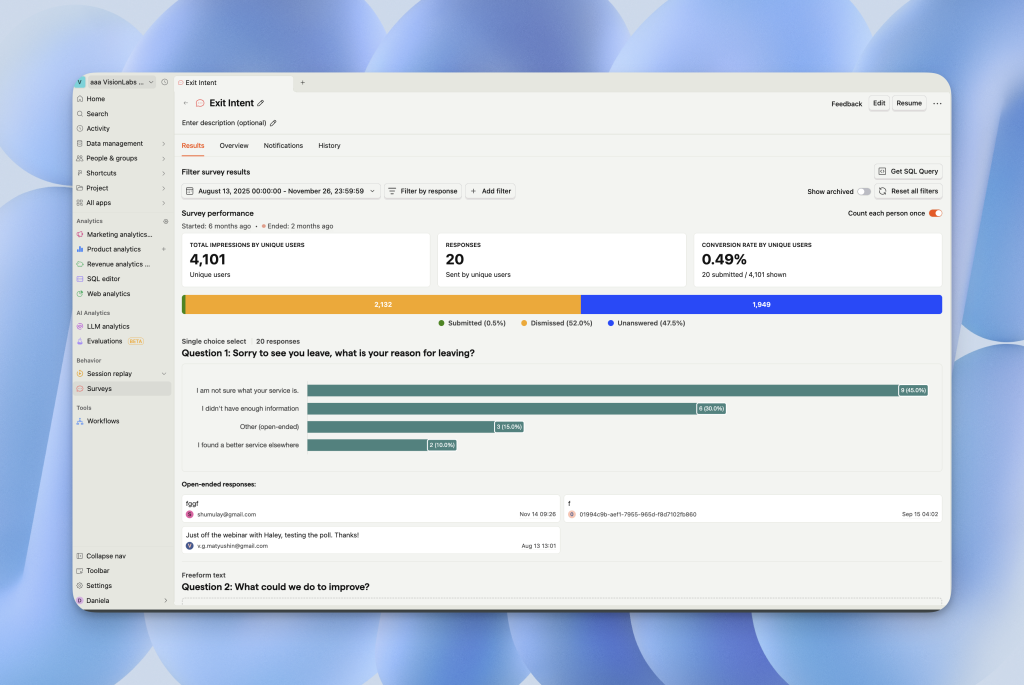
PostHog Surveys: Collect In-App Feedback
PostHog surveys appear as in-app popovers. Use them for NPS scores, feature feedback, onboarding questions, and exit surveys.
Survey Customization
Adjust colors and positioning in the survey editor. Target surveys by URL, user property, or cohort. Use the API for headless surveys in mobile apps.
Removing PostHog branding requires the Boost add-on ($250/month). For high-volume surveys, consider building a lightweight custom form and sending responses to PostHog via webhooks.
PostHog Notebooks: The Hidden Documentation Feature
Notebooks combine text, charts, and session recordings into shareable documents. Like Notion, but with live PostHog data.
Why Notebooks Matter
You can document investigations by embedding trend charts with annotations like “Traffic dropped Jan 24, here’s the data.” Recordings expire after 30 days unless saved to a notebook. Create “how to read this dashboard” guides with live examples to onboard teammates.
Notebooks turn PostHog from a reporting tool into a knowledge base.
How to Unlock All PostHog Features (Free Tier Trick)
PostHog gates some features behind adding a credit card. Here’s how to access everything without spending a dollar.
Add a credit card to your account, go to Settings > Billing, and set the billing limit to $0 for each feature. This unlocks the full free tier: 1 million events, 5,000 session replays, and 250 survey responses per month without surprise charges.
What We Didn’t Cover (And When You Need It)
This guide skips feature flags (roll out features to segments before full launch), experiments (A/B test with statistical significance), and heat maps (visualize click density on pages).
Master the foundations first. Layer on flags and experiments once your event structure and dashboards are solid.
Next Steps: Get Help With PostHog Implementation
Setting up PostHog correctly (event naming, dashboard architecture, destination configuration) determines whether you get value from the tool.
Vision Labs implements PostHog for PLG startups, enterprise SaaS, and ecommerce brands spending $0 to $250K/month on ads. We’ve configured 20+ PostHog accounts across every acquisition model.
We handle event taxonomy and tracking plans, dashboard builds for marketing and product, Meta CAPI and CRM integrations, and cost optimization and billing controls. Explore our PostHog services or learn more in the PostHog academy.
Book a free consultation: visionlabs.com/contact
Tell us where you are and where you want to be. We’ll map the fastest path to clean data and actionable dashboards.