Overview
In this article, we want to share everything we’ve learned in measuring digital businesses & Recurring Revenue (and help you avoid our mistakes!)
I have been helping clients measure their marketing for years now. I have been on the promotional side of advertising and monetization side of automation & product management. Now 100% focused on measurement i decided to write this article.
The first thing to note is that this will be written from the business owners’ or founders’ perspective. Media buyers, Social Media Managers, & Data Scientists Might cringe as these methods are a bit more Marketing and a little less “P-Value”.
If that is your vibe, Welcome.

Some Helpful Context Before We Move Forward:
- My name is JJ, my team and I manage custom measurement for companies around the world.
- Measurement = building a journey around user intent. Not just hits and P values… Intent.
- I have a background in Facebook Media Buying, Start Ups, & Agency Life. Now providing measurement that background helps me understand where you are coming from and hopefully “speak your language”
- We manage around 5 billion Hits of marketing data every year.💪🏽
- We use the Google Tech Stack
This guide should serve you well as you begin to grow your product and scale to reach more people & colder audiences.
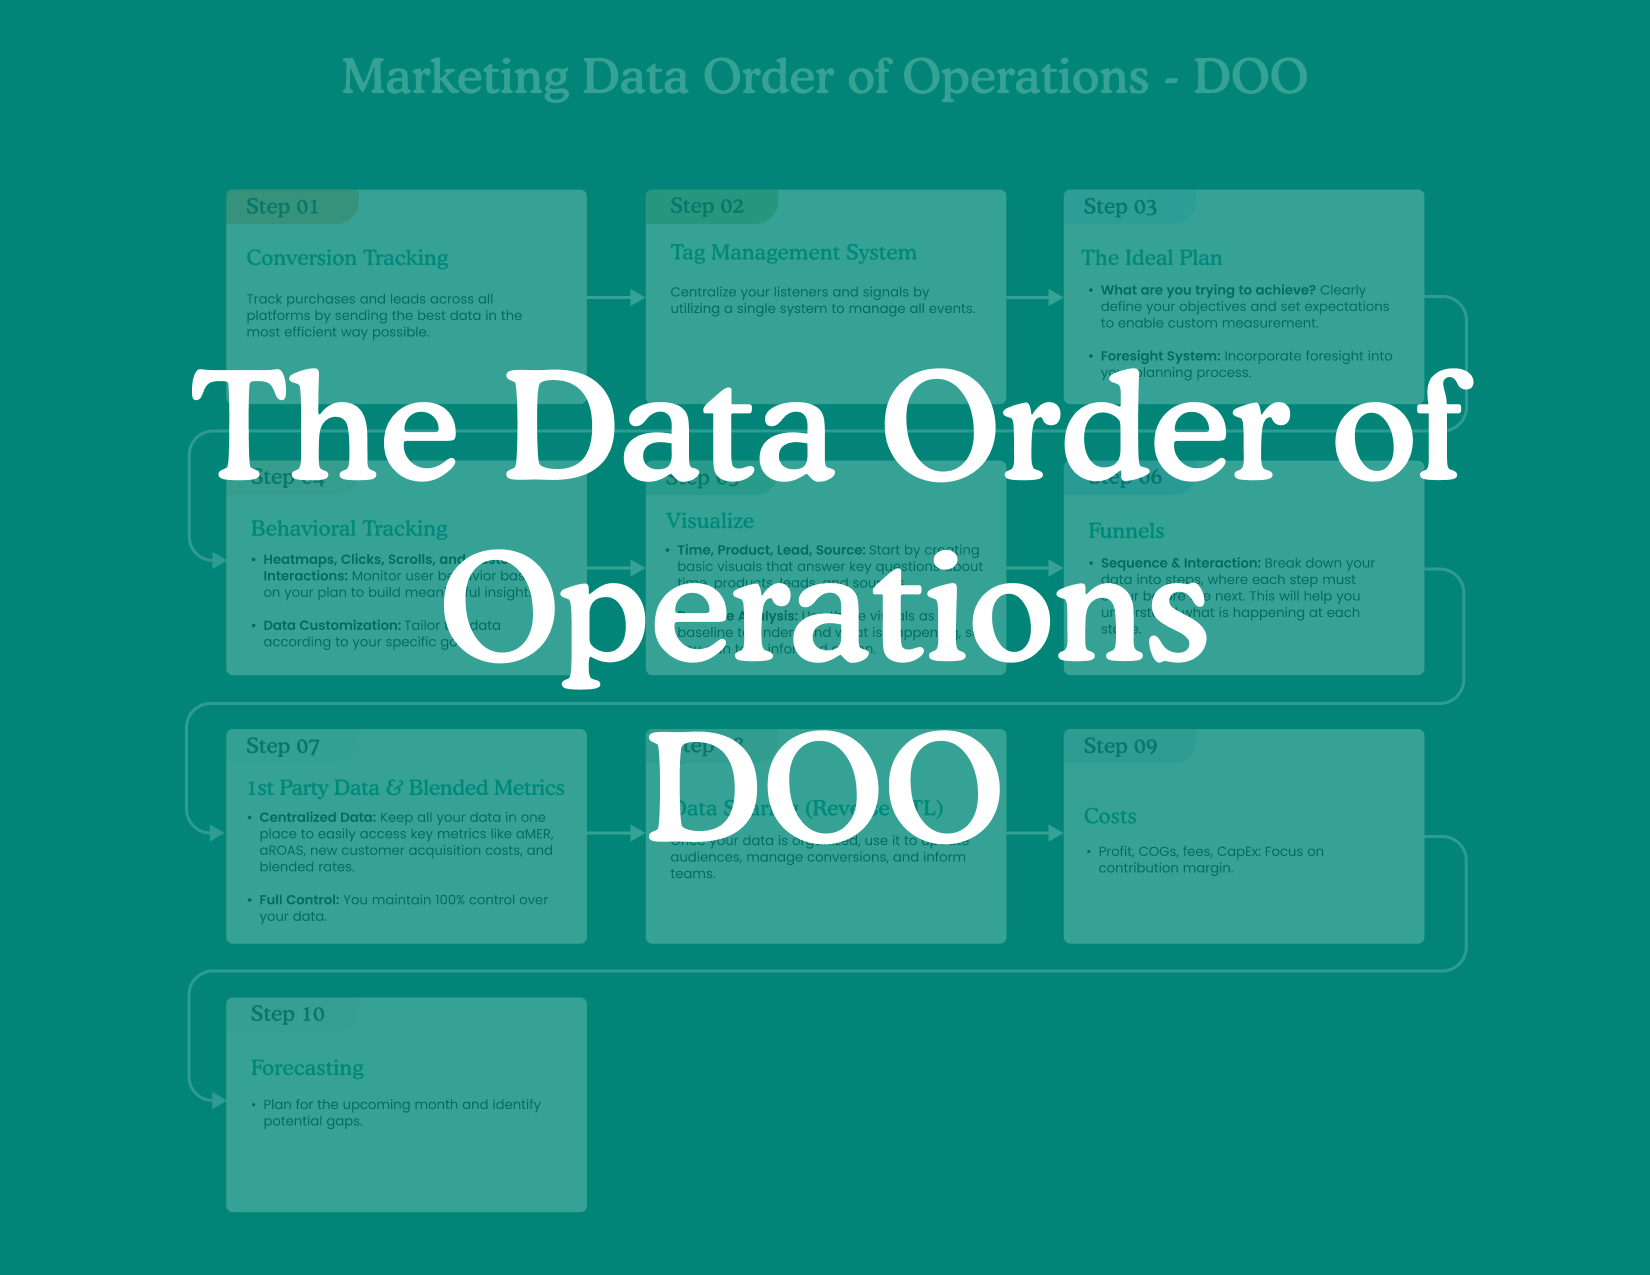
Step 1: Identify Your Main Optimization Points (These are what you will be measuring for)
In order to measure anything of usefulness, you will need to identify your optimization points. These are the pieces of your website, messaging, and flow that has the potential to change and easily affect the metric you are measuring for.
Most SaaS businesses have one or all of the following offers
- Leads
- Offers/Promos
- Upgrades
- Trials
- Free Accounts
Each of those ideas has a Journey to accomplish with. First they must become aware of the concept that you offer that way to enter the system, then that take action on that.
Take a piece of paper and draw out what that looks like. Ill follow along and do this with you 😂
Create a drawing of your users ideal path.
Step 2: Measuring for Usefulness NOT Accuracy
You now have a list of the “how people can enter your ecosystem”. But have no idea of what that looks like in your data. Most likely you have revenue in your bank account or trials from a developer who runs a query of your data base.
That is not useful from a marketer’s perspective. In fact it’s quite useless!
Knowing the amount of money in a bank account or amount of users in a system does not help you take an action.
What is useful you ask? Knowing how they got there. (dollars & people)
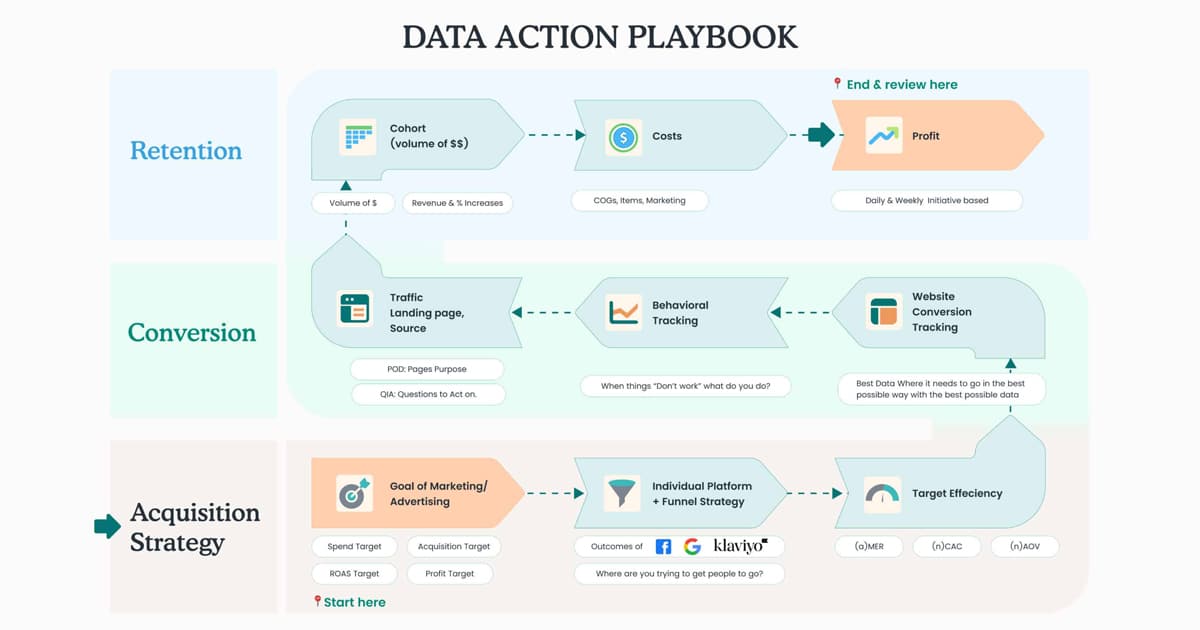
Some Marketers like to call this the user journey, customer value journey funnel, etc.
So this is what we are going to do.
Take each of those offers you just wrote down and we are going to look at the following metrics:
- How many people saw the means to sign up
- How many people engaged with that offer.
- How many people took the action of giving you their email address or booking a demo
Some people call this a funnel, I like to call them journeys 🙂. What can I say… I am a marketer.
Add Image of Form Arrow to right with info in it then submission
This could be as simple or as complex as the below options:
- A person viewed page /sign-up (Good enough to get going)
- Using the built in form triggers in Google Tag Manager (Better)
- Having a developer push the submission info to the DataLayer Push on submission (Advised)
“I get it, but how are you going to measure for awareness, engagement & conversion?”
Tech stacks are a conversation starter for sure, especially amongst startups and digital companies.
I like to keep them simple. Stay within the Google ecosystem. The tools are affordable, customizable, scalable, and you own them (as much as you can own something on the internet nowadays).
Nothing scares me more than new analytics start up promising to “Manage All Your Customer Data” or “Build your customer journey”. What can I say, I like control.
Google’s Marketing Tech Stack Suggestions:
You might think this is remarkably simple and it is. That is why I love it and why we can get useful actionable answers faster than most other “data people”.
Listener & Script Manager = Google Tag Manager
Attribution = Google Analytics
Optimization = Google Optimize
Storage = Google Big Query
Visualization = Google DataStudio
Ta da!
Other Tech Stacks Problem:
The problem with the other technologies is they do not play well with others. They usually say something along the lines of “We integrate with X” but then when you press further its not a full integration just data sending. It might be a bit more work, but our clients agree sticking with Google is a great path.
Here are a few few of those… other options we hear of quite often.
Oribi
Fathom Analytics
Segment
Heap
The list is never-ending but ill end it here.
My Advice: Stick with Google and add on tech-specific products as needed
Technologies to Avoid:
Yes, there are technologies you need to avoid. Try to stay away from anything that tries to map out every single interaction to purchase/lead/etc. They might be cool and fancy, but they are not useful. I wrote a whole blog post on “Usefulness”.
Hyros, Wicked Reports, Segmetrics, & anytrack are the style of SaaS, I would try to avoid. ( I didn’t even link them)
In short, it is sort of like trying to catch a fish at the exact same spot every day. It probably won’t work out, but if you realize in the north side of the pond using worms and your favorite lure you catch more fish. that is Actionable.
Step 3: Idealize Your Actions WYGDAI
Everything you measure needs to have a baseline metric and something do when that metric is good or bad. WYGDAI =
What
You
Gonna
Do
About
It
WYGDAI Examples
If you see your leads are 10x as many, What are you going to do? Probably double down on that traffic source.
If you see that revenue is low on Facebook CPC traffic, What are you going to do? Probably check in with your Facebook Media Buyer to see what they are doing, testing, or failing at,.
If you see that no FREE Accounts are converting to Paid accounts, what are you going to do? Probably add a more pronounced way to upgrade or means to learn about the product offering.
9/10 companies do not put a stipulation around what they will do when something goes well or goes poorly. If you run a campaign for a BOGO and only receive 5% more sales that week, does that mean not do it again or reframe the messaging? What if you do 50% more sales? should you do more or less?
If you have read this far, that is the take away WYGDAI. Do something with your data.
Please do not just look at it.
I have had clients where I build a dashboard that has a clear action. If sales are below 20% then adjust paid traffic. But no action is taken. No one says, oh this metric is off lets do something about it.
Do not be that company. Own your numbers. Own them when they are up and Own them when they are down
Step 4: Store Your Data
Now that you have an idea of what you are measuring and why you are measuring that information now you have to start making decisions about where that information lives.
Most companies have the following:
Acquisition Data: Usually kept in Google Analytics (or a variation there of)
Customer Data: Usually stored in a CRM of some sort (Hubspot, Active Campaign, Salesforce, Etc)
Payment Processor Data: Usually stored in Stripe or Cart System
Platform Data: Your SaaS Platform User Information
The problem is that once you want to start understanding Value by Source, you now are looking at Acquisition Data & Payment Processor Data at the same time. Uh oh.
How do you solve this Data Fragmentation problem? (User ID)
You solve this by having a Unique Key that ties the three together.
What is a unique key you ask?
The most common identifier is a User ID. 9/10 a company does not keep this user ID across all platforms and it becomes chaos trying to figure out what is “working”.
By default Email platforms will make this User ID the Email address. Only problem with that is you can not user an email address where PII (personal Identifiable Information) is not allowed Google Analytics is one example of that.
Step #1 Identify your unique source of truth. This might be the Stripe Customer ID, your Platform user ID, or CRM User ID. Whatever it is, we want to make sure that is vocalized.
Step #2: makes sure you have that stored in your other platforms. For this example we will use the CRM User ID as the User ID. Here is how to do that in every platform we use:
Google Analytics: How to Set Up User ID
Stripe: Customer Object – User ID
CRMs: There are too many, but Google “%Your CRM% Custom User ID”
Your Platform: will already have it.
Now you have those all in one place 🙂
Step #3 Decide what questions you want to answer
You might be able to answer all of your questions by having a single Dashboard with multiple data sources then filtering by User ID. (As Seen Below)
or you might need to do some more complex data blending or joining those fields.
This is not a Big Query SQL resource, but if you want to learn about that, CodingIsForLosers is a great resource!
What I will say is that in google sheets you will start with using VLookUps to answer basic questions then move to Queries and ultimately to full SQL using Joins and filters.
Some platforms will promise do do this for you, but it either is extremely black box or extremely complicated and you might as well do it yourself.
Step 5: Visualize Your Information
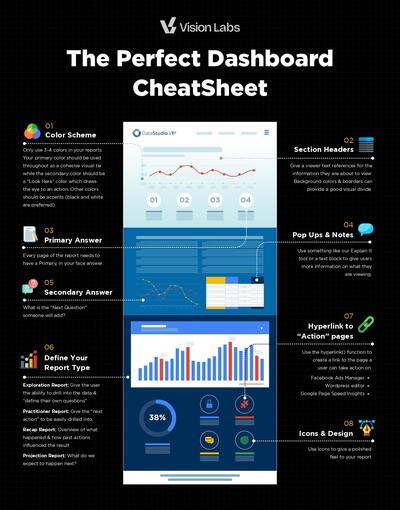
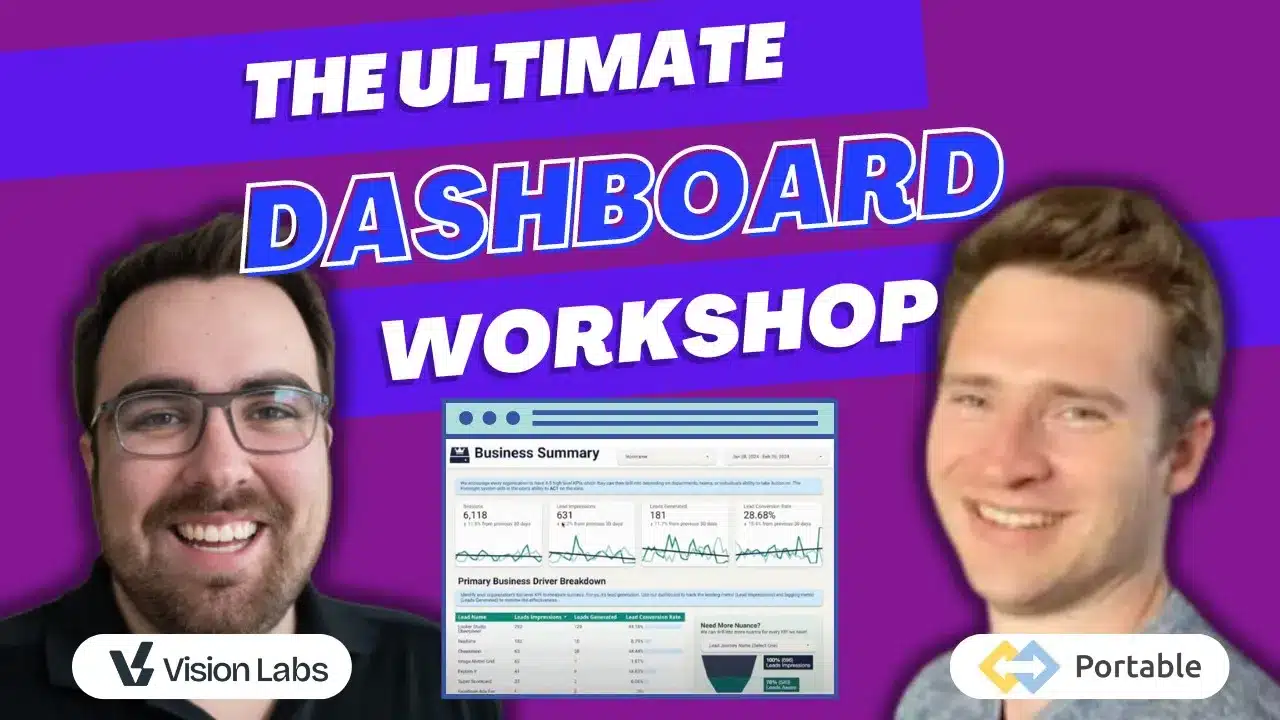
This is the fun Part 🙂 You get to visualize what you are looking at! Take a look at our template that we build out the majority of our dashboards off of. This is the base, then we add in things like Blog engagment CAC with adspend and all those goodies.
https://datastudio.google.com/embed/reporting/b25c5221-c1e0-4a8e-833e-5b3347910020/page/lfDCC
Step #1: Plan
This is where you take all of the above information your data sources and figure out “What questions can I take action on” and “how would this best be visualized”? Once you do that, you are able to build out your dashboards.
I personally like to start in MIRO. Build out the core wire frame of what it will look like by data source, dimentions, and Metric. Then move into Google Data Studio
Step #2: Strategies
Strategizing might seem redundant with your plan, but you want to make sure you have the information needed to get the visualizations you are looking for. This might require adding new dimensions to Data Studio or building your own calculated metrics in Data Studio.
This strategizing will save you hours and hours on the other side.
There will be 10 different ways to do it, Know why you chose your way.
Step #3: Visualize
Now you can build it out in Data Studio, feel free to use our demo dashboard as an example and build your core features off of that.
Please remember that Cute is great but Actionable is better!
Recap of What to do!
- Make sure you have your Google Analytics account set up with Awareness, Engagement & Conversion at a minimum.
- Find your unique identifier that will join all three of your accounts together.
- Create 1 master table with your new joined datasources to answer your questions!
- Ask good questions to make sure you have those answers in your visualizations!
Yay!! Glad that worked out!


