Give your report users the ability to 🎶 ♫ touch, love, & squeeze 🎶 ♫*(Journey Reference)* the data without being an SQL expert or even knowing how the report works aka, build a dummy-proof report!
Report controls & interactions allow Looker Studio viewers to apply criteria, cross filter information & save custom report links with their pre-filled filters.
This gives your report viewers the ability to slice data in ways a static report viewer would never be able to do.
You can filter at the page, group, & report level!
We are going to start at the more *fun Controls, then work our way to the most common ones. If you want to go to the Basics View Basics
Watch The Tutorial 👇
Input Box & Advanced Filter: How to Make Them Special 😉
Most people just use the date and maybe a drop down selector, but we are going to give practical examples to WOW everyone using the filter types.

Imagine this: You finished a report and are about to send it to your boss or client
🛑STOP🚫
Add these final touches to make it POP!
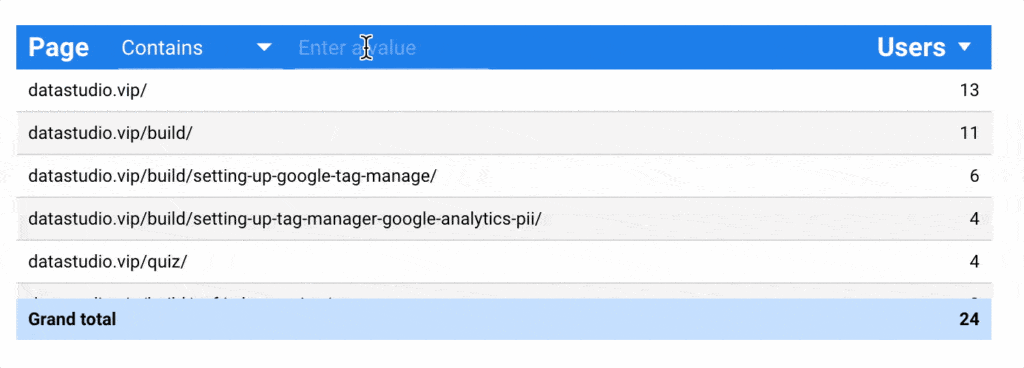
Put an advanced filter or filter box on top of a table to make it ‘filterable’ for any pattern an end user would like.
How The Sausage 🌭 Is Made
Step 1: Create a Table
Create a simple table with a dimension on your far left being a longer dimension. You will see in our example we use Google Analytics Page URL. But you could use this tactic with anything.
Color doesn’t matter, but if your table header is dark, make your text white #Design101 😂
Step 2: Add an ‘Advanced Filter’
From the “Add a Control” menu, drag the ‘Advanced Filter’ on the report and select the same dimension to filter as the table you are putting it over.
💥 Boom – Done!
Step 3: Let’s Style This Sucker
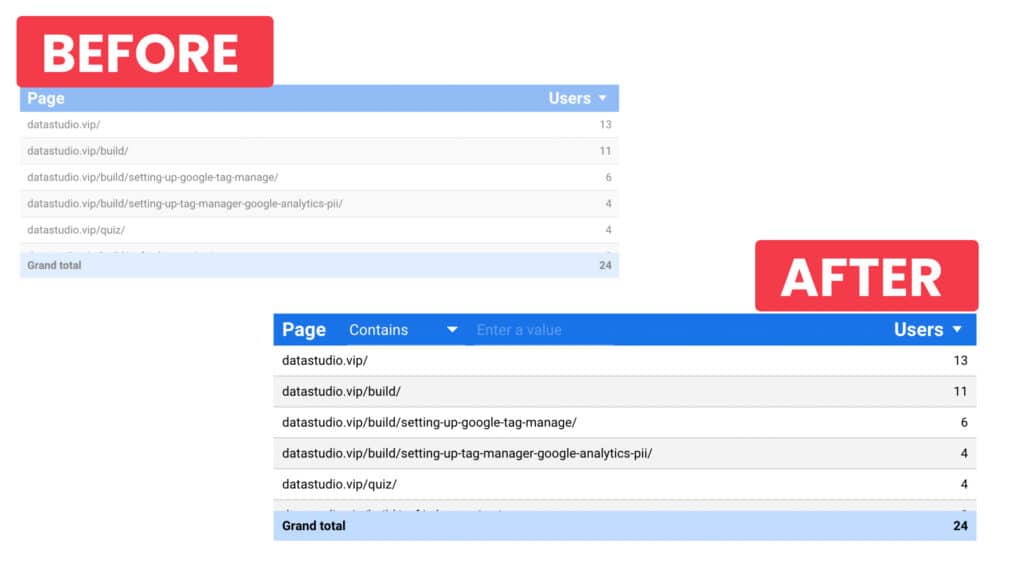
In the ‘style’ tab editor you are going to make sure the background Is transparent, fixed size, & label position is hidden.
Since the page is in the table, it serves as the visual key as to what you are about to filter.
Really Important: Make sure that your ‘Advanced Filter’ is above the table. Use the short cut “CMD + Up arrow” to bring it to the top – view all the GDS short cuts
Pro-tip: If you are struggling to line things up, hold SHIFT and push the arrow in the direction you want it to move. This will move it 1 pixel at a time. See here for full shortcut hacks.
Using The CheckBox: Finally Someone Gives an Example!
I struggled for a longtime to figure out WTF to do with this check box. Every time I thought I had a use-case I would end up getting an error code just like this 👇👇👇

Let me save you from my pitfall of not reading anything
👉 THE CHECKBOX ONLY WORKS FOR BOOLEAN VALUES!!!!!!
What is a boolean? Glad you asked 😉
A Boolean is a true/false statement. There are no other options, but true or false.
But how do we get a true false statement & why would we need that?
Example Let’s say you have a help desk.
- LookerStudio.VIP = Marketing Domain
- help.LookerStudio.VIP = **Help Desk **(not really, don’t go there, it’s just an example)
- courses.LookerStudio.VIP = Courses ****(not really, don’t go there, it’s just an example)
Now Imagine you wanted to only analyze your marketing domain? How would you do that? Sure you could have a hostname filter, but that is totally lame 👎**. We are wanting that year-end BONUS!**
So, what you can do is create a checkmark that looks like this

Pretty sweet right?
How To Add A Checkbox To Your Report!
Step 1: Add the checkbox to your report
Drag and drop the checkbox on your report. Odds are that it will show an error. Don’t panic… yet 😅
Step 2: Create Your True/False Statement
What will do 9/10 is create a new field that is just a Regexp_Match() function which when true will be the filter I want.
//This is saying any page that starts with "LookerStudio.VIP" is selected
REGEXP_MATCH(Page,'^LookerStudio.VIP.*')
You can use anything!
For example, say you had a dimension in your stripe account that identify if they were on a subscription plan or not. You could simply put:
{{Invoice Type}} = "Subscription"
Everywhere that the ‘Invoice Type’ = Subscription will show when the toggle is turned on!
The Mic Has Been Dropped ☁️→ 🎤 → 🎢 → 💔
But wait, it gets better!
How To Save A Report For Anyone To Link To
Let’s imagine you have 3 departments: Facebook Ads, Google Ads, & Affiliate Management.
Each of these lovely departments is asking for a report that loads with all of their data in it. The problem is that they load the report then have to toggle on/off the traffic sources they are responsible for using a ‘drop-down filter’ or ‘fixed-size list filter’.
But we are Looker Studio VIPs. (Hey, you are reading this, so I consider you a VIP in my book 🙂)
We want it to load with their unique data, without them having to spend precious time clicking, waiting & looking.
Step 1: Add A Fixed Sized List Filter
Grab yourself a fixed sized list filter & put it anywhere on the report. If you already have one on the page, that is perfect, no need to do this.
Step 2: Adjust Report Settings
File > Report Settings > Custom Report Links (toggle that on)

This is going to allow you to load a report with parameters in the URL which will filter the report.
Step 3: Head back to your filter
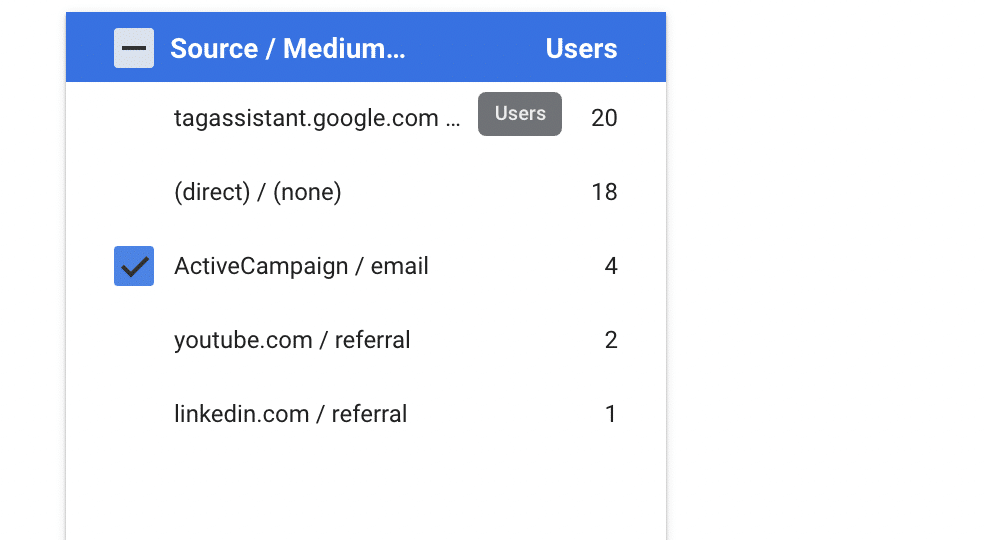
In view mode select all of the filters you would like to utilize.
Example: You want the Facebook Ads people to start looking at the last click data for their Ads. So, you create a ‘Source / Medium’ Filter with the “Facebook / cpc” selected (in my case, I am using ‘ActiveCampaign / email’).
Then grab that URL:
<https://datastudio.google.com/reporting/f335a41b-8f4b-4060-93c6-3c127db6c758/page/edGlC?params=%7B%22df8%22:%22include%25EE%2580%25800%25EE%2580%2580IN%25EE%2580%2580ActiveCampaign%2520%252F%2520email%22%7D>
You can see in that URL, the params = and what is included.
Bottom line is, this URL will load up the report!
Send this to your people & now you are good to go!
What If You Do Not Want a filter on the Page?
No problem, you can simply put this filter outside of the report and it will still load with all the goodies.
It’s off to the side of the report & no viewer will ever know 🙂
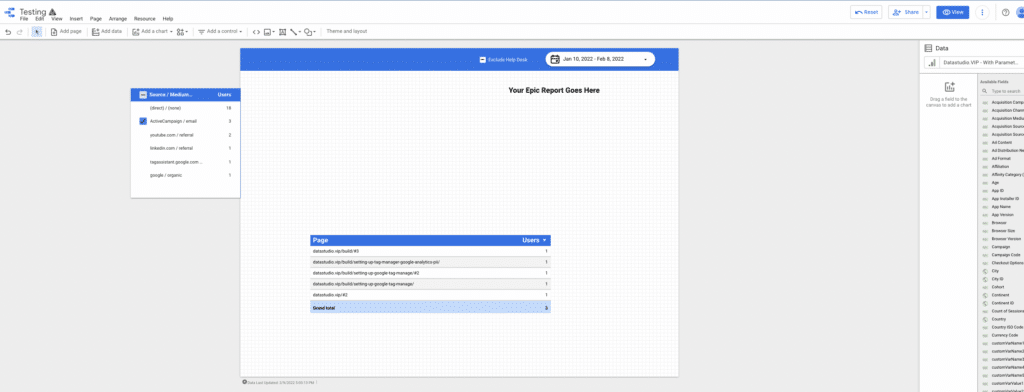
Date Range Control: The Most Common of all Controls
The most common Looker Studio control is the date control 99.99% of people have used this in their journey. It’s actually the first thing I add to any report I build.
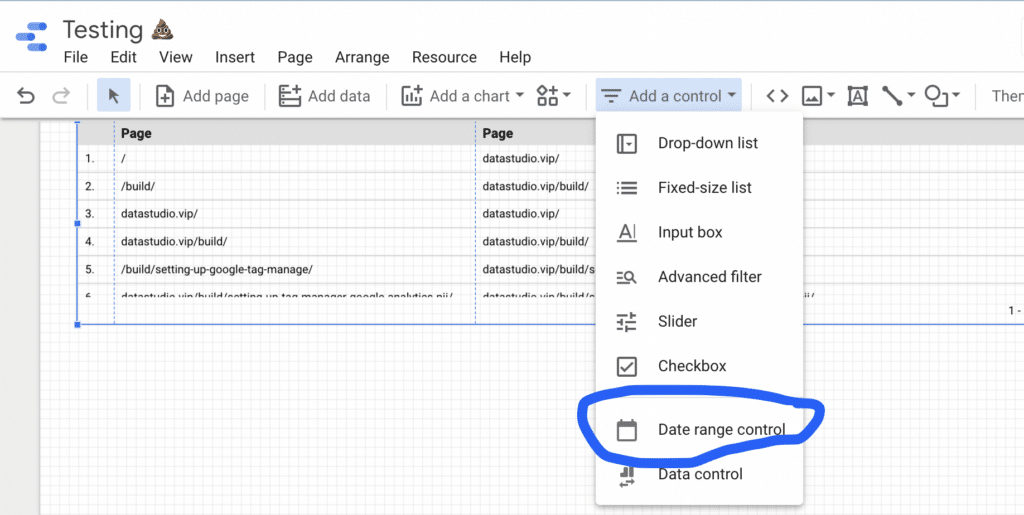
If you are a builder of GDS reports of other, like resellers or an agency, you will be familiar with the “Data Control”, but most all people do not give a flying hoot about a data control.
If you know of a good use case for it LMK! (Shoot me an email at jj(@)lookerstudio(dot)vip I’d love to update this article).
With the date range control, you have the basics of being able to select when the default start & stop date of the report is.
I tend to leave it at last 14 days, but you can make a case for any default depending on the use case. Lot’s of fun presets, as well.
Bonus: Add an Icon Overlay
Use our Icons page to grab a calendar icon that matches your color tone. And put it over your calenadar link.
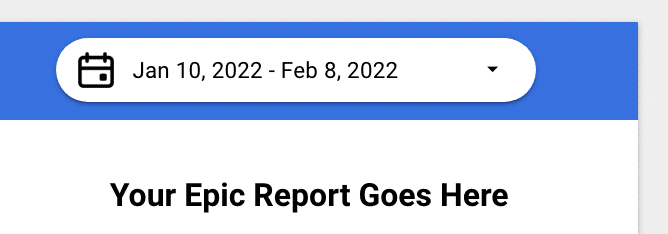
Just add 48-72px of padding to the left of the calendar control and put the icon over the top of it!
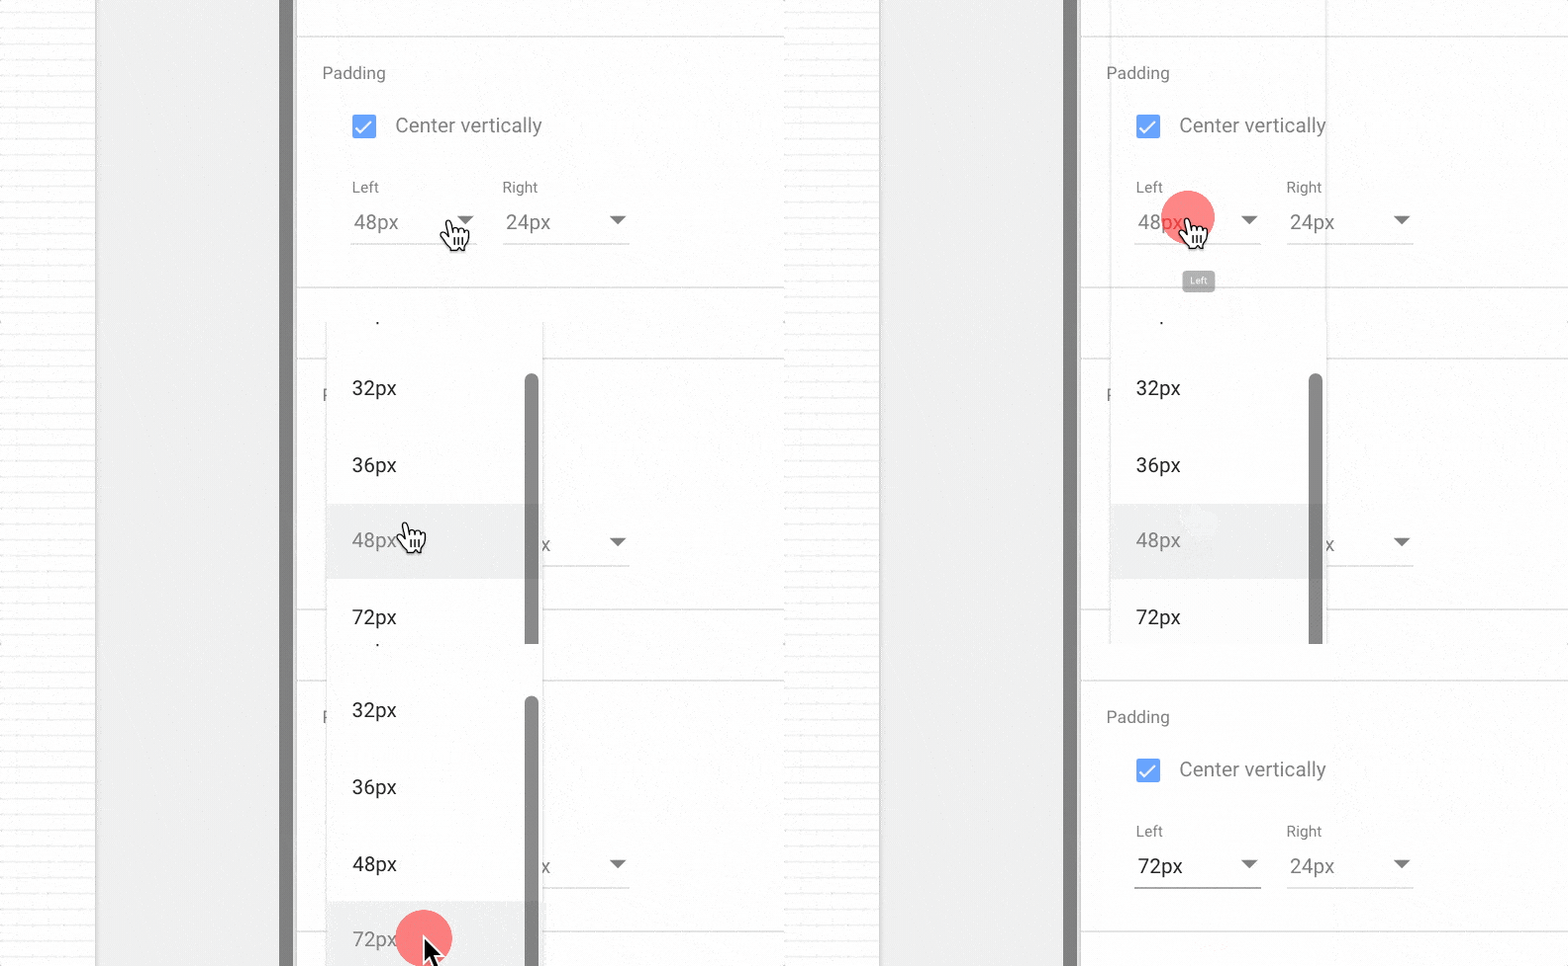
Ta da!
Now Go Wow Someone!
